
Distinguished cosmologist Professor Hiranya Peiris (UCL Physics & Astronomy) has been awarded the 2018 Fred Hoyle Medal and Prize by the Institute of Physics (IOP) for furthering our understanding of the origin and evolution of the cosmos.
The Institute of Physics annual awards recognise and reward excellence in individuals and teams who have made a contribution to physics in the UK and Ireland. Commenting on the 2018 award winners, IOP President, Professor Dame Julia Higgins said: “It is a pleasure for me to recognise and celebrate today exceptional physics by exceptional individuals.”
“This is how IOP – representing the whole physics community – honours those who produce the very best work. And it is this work that directly contributes to our economy, our everyday lives and towards tackling some of the biggest challenges we face in society. I would like to offer my warmest congratulations to all our winners.”
Professor Peiris, who also shared the 2018 Breakthrough Prize, conducts world-leading research that has significantly shaped our understanding of the origin of cosmological structure seeded in the first moments of the Universe.
Professor Peiris worked on the NASA satellite known as Wilkinson Microwave Anisotropy Probe (WMAP), which mapped the cosmic microwave background (CMB) – the light left over from the Big Bang – to allow scientists to work out the age of the Universe, its rate of expansion and its basic composition. She led the first paper testing theories of the early Universe with these seminal WMAP CMB observations, work that redefined the boundary between cosmology and high-energy physics.
Subsequently, Professor Peiris played key roles in the analysis of CMB data from ESA’s Planck satellite, and is a pioneer in the emerging field of astrostatistics, developing innovative statistical methods that now form part of the standard toolkit for cosmological data analysis.
In addition to her research achievements, the IOP identified her outreach work as outstanding, placing her amongst the very best advocates for cosmology.
At UCL, Professor Peiris is currently director of the Cosmoparticle Initiative, which is bringing together physicists from different research specialities to tackle fundamental questions at the interface of cosmology and particle physics.
Professor Peiris said “throughout my career I have been motivated by finding unexpected connections between different research areas. Right now we are facing deep questions in physics which cannot be answered by narrow approaches. I am excited to build connections enabling junior researchers to solve these problems using a diversity of techniques from different fields.”
Professor Peiris has served as Vice President of the Royal Astronomical Society and currently spends half her time directing the Oskar Klein Centre for Cosmoparticle Physics in Stockholm. In 2016, she was elected as a Fellow of the American Physical Society.
The Planck team, which includes researchers from UCL Physics & Astronomy and the Mullard Space Science Laboratory (MSSL), has been awarded the 2018 Gruber Cosmology Prize.
The Cosmology Prize honours leading cosmologists, astronomers, astrophysicists or scientific philosophers for theoretical, analytical, conceptual or observational discoveries leading to fundamental advances in our understanding of the Universe.
The Planck Team, part of an international collaboration organized by the European Space Agency (ESA), mapped the temperature and polarization of the cosmic microwave background radiation, the relic radiation of the big bang, with the ESA Planck satellite.
UCL researchers Prof. Hiranya Peiris (Physics & Astronomy), Dr Giorgio Savini (Physics & Astronomy), and Dr Jason McEwen (MSSL), and past and present members of their research teams (including Dr Stephen Feeney, Dr Franz Elsner, Dr Aurélien Benoit-Lévy and Dr Dipak Munshi), are involved in the Planck satellite mission and made important contributions to Planck instrumentation, analyses and data releases.
Giorgio Savini spent the five years prior to launch assembling and testing Planck’s cold optics, as well as testing and selecting all the other optical components, which constitute the “eyes” of the Planck High Frequency Instrument, so that the nature of the polarised signal observed by the Planck detectors can be reconstructed with very high precision.
Hiranya Peiris and Jason McEwen, and their research teams, played key roles in using the Planck cosmological data to understand the origin of cosmic structure in the early universe, the global geometry, isotropy and topology of the Universe, and its mass distribution.
“The Planck project has made definitive measurements of the properties of our expanding universe. This stunning achievement was the result of a large group effort, and we are pleased to recognize both the Planck team as a whole and its principal science team leaders.” Says Robert Kennicutt, University of Arizona, and Chair of the Selection Advisory Board to the Prize.
Use these links to find out more:
Cosmic microwave background data reveals insights into the period immediately after the Big Bang, while galaxy surveys can also help deepen our understanding of the Primordial Universe.
The hot Big-Bang model doesn’t explain where the Initial fluctuations in the density of the Universe came from, which led to all of the structure that’s in the universe today. Inflation is a mechanism by which you can create structure in the very early universe.
Interviewed for Beyond the Horizon (EU Research SPR18/P76), Professor Hiranya Peiris talks about the how CosmicDawn project’s work is using different sources of data to investigate the origins of cosmic structure, and test different theories in the laboratory.
Read the whole article here:
Shining a light on the beginning of the Universe
This article originally appeared in the UCL Spotlight series (31 January 2018)
What is your role and what does it involve?
I am a Professor of Astrophysics in the Department of Physics and Astronomy. My main field of research is cosmology, the study of the universe. I study the fossilized heat of the Big Bang, called the cosmic microwave background, to understand the physics that governed the very early universe. I use big surveys of galaxies to study how the universe is evolving, with a particular focus on measurements that constrain fundamental physics. I also work with theoretical physicists to develop physical models that explain cosmological observations. I am currently spending half my time away from UCL as Director of the Oskar Klein Centre for Cosmoparticle Physics in Stockholm. I am also the Principal Investigator of the CosmicDawn project, funded by the European Research Council.
How long have you been at UCL and what was your previous role?
I have been at UCL since 2009 when I arrived as a brand new lecturer. Previously, I was a postdoctoral fellow at the University of Cambridge.
What working achievement or initiative are you most proud of?
I am proud of my ERC CosmicDawn project which allowed me to build an internationally visible group in early universe cosmology from scratch at UCL, working on a very difficult question: where did everything in the universe come from? The project allowed me to work on a wide range of interesting research directions, and mentor some brilliant junior researchers who have gone on to do great science. I am very proud in particular of all my PhD students and their achievements. The most rewarding part of my job is to help early career researchers to flourish and achieve their potential.
Tell us about a project you are working on now which is top of your to-do list?
I am very excited about the new UCL Cosmoparticle Initiative, of which I am Director. This is a five-year programme linking cosmologists, high energy physicists and space scientists at the Department of Physics and Astronomy and the Mullard Space Science Laboratory. The project promotes interdisciplinary research between particle physics and cosmology – the study of the very small and the very large is intertwined through fundamental physics. We also run an international visitor exchange programme, connecting us to external expertise and collaborations.
What is your favourite album, film and novel?
The Dark Side of the Moon by Pink Floyd; 2001: A Space Odyssey; The Hole in the Zero by M.K. Joseph. I don’t like this question actually – I like a huge range of things and don’t like to rank them.
What is your favourite joke (pre-watershed)?
What do you call a confused tourist blocking the pavement outside the Natural History Museum? A meanderthal.
Who would be your dream dinner guests?
Carl Sagan, Emmy Noether, Roger Waters, Douglas Adams
What advice would you give your younger self?
It’s okay to ask for help.
What would it surprise people to know about you?
I had an indie/alternative radio show on Cambridge University Radio as an undergrad, and would not have minded a career as a music producer.
What is your favourite place?
Toss-up between Cradle Mountain in Tasmania or Landmannalaugar in Iceland.
This post was written by Keir K. Rogers
Here at UCL, we’ve been working on the small problem of the origin of the largest structures known to humans — the ordered arrangement of galaxies in space. We have an elegant theory that can trace back these formations to microscopic fluctuations during an accelerated expansion at the Big Bang called cosmic inflation. We’ve even predicted a signal in the afterglow of the Big Bang that — if discovered — would teach us the physics of inflation. But, searches for this signal are hampered by the glow from particles in the Milky Way. We have developed and tested a method that could help to clean away these foregrounds and give us a clear view of the primordial signal that reveals the origin of structure.
The cosmic web

Figure 1: galaxies as seen by the Sloan Digital Sky Survey (SDSS) are arranged into a web-like pattern. Red shows the dense clusters and green shows less dense regions. Image credit: SDSS
Since the ancient Greeks first put the Sun at the centre of the Universe, we have wondered what is the order of the heavens? When we today map the positions of the hundreds of millions of galaxies that we have observed so far, we see them trace out a remarkable structure. They are gathered into a complex network of dense clusters, long filaments, wide walls and vast voids in-between: all together, we call this panoply the cosmic web (figure 1). As we look back into space (and so in time), we realise that, as the Universe aged, galaxies gravitationally attracted each other into ever larger conglomerations. But we can ask and try to answer a question far more profound than the ancient Greeks did (who were not interested in applying their laws of physics beyond the Earthly realm): why are the heavens ordered the way they are? What is the origin of the order we see in space?
When we map the sky at microwave frequencies, we see a faint background of light. This cosmic microwave background (CMB) originates from the baby Universe — when it was only 380,000 years old. The photons have travelled towards us — largely unimpeded — for the over 13 billion years since. The temperature of this background is impressively uniform across the sky. The fluctuations are minuscule — amounting to only one part in a 100,000.
The seeds of cosmic structure are traced by the tiny fluctuations in the CMB. They give us the positions of the small over- and under-densities in the matter distribution in the early Universe, which eventually grew under gravity into the clusters and voids we see today. But what is the origin of these tiny perturbations superposed on a smooth background?
The theory of inflation as the origin of structure
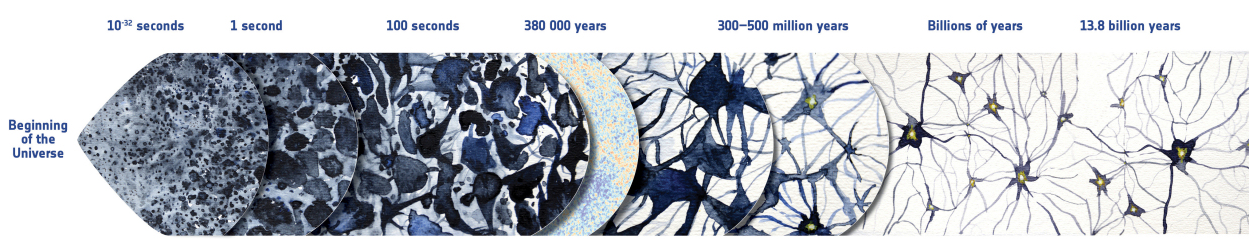
Figure 2: a schematic view of the theory of inflation as the origin of the cosmic web. Quantum fluctuations at the beginning of the Universe (left-hand side) grew over the length of cosmic history into the clusters and filaments of galaxies we see today, 13.8 billion years later (right-hand side). We can observe light released at 380,000 years (the cosmic microwave background) to see an intermediate point in this evolution. Image credit: European Space Agency (ESA)
The leading theoretical explanation is a lightning-fast burst of accelerated expansion of space in the first fraction of a second of the Universe — called cosmic inflation. This expansion pushed apart regions of space that were in causal contact — and so were smoothed out. Only at the end, do we begin to regain contact with ever more distant patches of space. Moreover, this expansion can be driven by a scalar field and an associated particle, the inflaton. Quantum fluctuations in this field were expanded to macroscopic scales by the end of inflation. These fluctuations were the source of the primordial density perturbations that are the seeds of structure (figure 2). Inflation can elegantly answer the question of the origin of structure — and provide the smooth background we see in the CMB.
There is some evidence to support the theory of inflation — in the way the CMB fluctuations are patterned in the sky. But there is a key prediction that would provide truly compelling evidence. This is the generation of a background of gravitational waves — oscillations in the fabric of spacetime. Unfortunately for us, these ripples are far too weak for our current technology to directly detect. We are only just now sensing the relatively violent disruptions from merging massive stars. There is more hope with the next generations of interferometers which will deploy in space; though it will probably be decades before we gain any significant insight in this way. Fortunately for us, the Universe has built a far larger instrument that we can use: the CMB.
Primordial CMB B modes as evidence for inflation
It turns out there is far more information lurking in the CMB than just the temperature fluctuations. The CMB is (partially) linearly polarised; this means there is a preferred direction in the oscillations of the electric and magnetic fields that make up the light. It’s convenient for us to split these polarisation measurements into what we call E and B modes, depending on their properties. Gravitational waves should be the only primordial source of B modes in the CMB. This has the remarkable consequence that a detection of primordial polarisation B modes in the CMB would provide the compelling evidence for inflation we’ve been looking for!
Of course, life is not that simple! There are at least two more sources of CMB B modes that we need to worry about. The first is lensing B modes. This is the deflection of CMB photons by massive structures like galaxy clusters — known as gravitational lensing. This has the effect of distorting primordial E modes into B modes. We need sophisticated statistical methods to separate the primordial and lensing signals. A measurement of the lensing modes gives us unique information about the distribution of the cosmic structure that deflected the CMB photons — as well as properties of subatomic particles called neutrinos that affect this structure.
Polarised microwave foregrounds

Figure 3: a full-sky map (in Mollweide projection) of the polarised microwave radiation (at 353 GHz) released by dust particles in the Milky Way. The colour shows the amplitude of the polarisation: red is higher amplitude and blue is lower amplitude. The drapery pattern shows the direction of the polarisation and reveals the filamentary nature of polarised microwave foregrounds. Image credit: ESA Planck
The second contamination is somewhat closer to home — for cosmologists, at least! It is polarised foreground radiation from sources in our own Milky Way. At lower microwave frequencies, we face the problem of polarised synchrotron radiation. This is emitted by electrons that are accelerated in the Galaxy’s giant magnetic field. At higher microwave frequencies, we need to deal with polarised thermal dust radiation. The Milky Way is teeming with tiny grains of dust spread out in interstellar space. These grains are aspherical and so the thermalised radiation they release is polarised — and the direction of the polarisation traces the magnetic field. At least, this is a simple picture of it. There are wildly-varying directions in the turbulent Galactic magnetic field, which makes it challenging to model polarised dust emission. New datasets have revealed the complex, filamentary nature of polarised foregrounds (figure 3). But it is far from being a solved problem — there is no sliver of the sky that is clean of dust!
The BICEP collaboration of scientists found this out when, in 2014, they declared detection of primordial B modes with their telescope at the South Pole. They thought they were looking at a clean patch of the sky. But new data later showed it wasn’t as clean as they had hoped and the signal could be fully attributed to dust. The search continues with new generations of upgraded telescopes scanning the sky.
A clear view of the primordial Universe
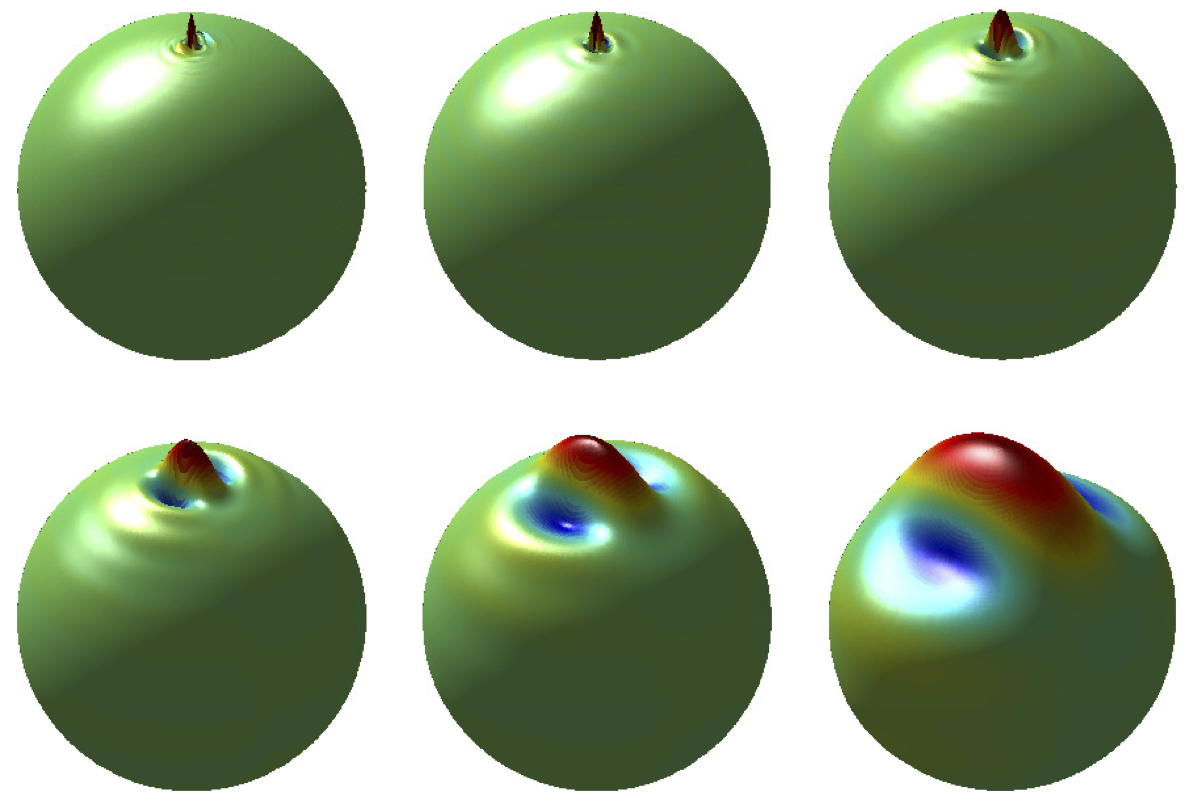
Figure 4: some examples of the directional wavelets we use in our method. They are special filters for signals that are measured on the surface of a sphere (like the CMB, since the full sky forms the inside surface of a sphere). They can be manipulated into different sizes and widths as required, including to match the dust filaments seen in Fig. 3. Red, raised parts show positive response and blue, depressed parts show negative response. Image credit: Jason McEwen
Here at UCL, we worked on a new and different approach to leaping the hurdle of foreground contamination. We wanted to exploit our knowledge of the filamentary nature of polarised foregrounds — but to sidestep having to construct a very detailed picture of the complicated interaction between grains of dust and the Galaxy’s magnetic field. To do this, we needed to use special sets of filters called wavelets. Unlike previous kinds, these wavelets are directional. This means that their shapes are not symmetric about their centre, but long and squeezed. In fact, they can be varied to match the shapes and sizes of the dust filaments we want to remove from our measurements (figure 4)!
The other side of our approach is to exploit another aspect of our data. We map the microwave radiation in the sky at many different frequencies across the microwave spectrum. At low frequencies (about 30 GHz), it’s dominated by synchrotron photons. At high frequencies (about 300 GHz), it’s dominated by thermal dust photons. We can effectively use these maps as templates for the foreground contamination and subtract them from a map we make at a middle frequency (about 100 GHz). Then we should be left with (mostly) primordial and lensing signal. The simplest way to do this addition and subtraction of maps is to make an internal linear combination (ILC). This adds and subtracts multiple maps with different weights for each one — e.g., the Planck satellite provides seven such maps for this purpose. The weights are optimally chosen to minimise the amount of contamination in our final map of the cosmological signal.
Now we can put all the pieces together. We might expect that the optimal weights will depend on the structure and shape of the foreground filaments. They are each a different physical region of the Milky Way. But, we’d like a way to disentangle these filaments. Well, this is exactly what the directional wavelets can do! If we first filter our input maps with these wavelets, picking out filaments of a certain size, shape and orientation, then we can apply the ILC in a localised way.
We tested our method on the latest data from the Planck satellite and found that it certainly has the potential to help clean observations by future experiments! This is an exciting result. It seems now that through a combination of new methods like these, a better understanding of polarised foregrounds and more sensitive data, we have a good chance of detecting primordial B modes in the future. If they’re there to be detected! Nature could be cruel to us and make the background so weak we have no chance of finding it. Or the theory of inflation may be wrong — and there is no background of gravitational waves to discover! Whatever the outcome, it will teach us some profound truths about the origin of the Universe.
You can read more here:
K.K. Rogers, H. V. Peiris, B. Leistedt, J. D. McEwen, A. Pontzen
SILC: a new Planck internal linear combination CMB temperature map using directional wavelets
K.K. Rogers, H. V. Peiris, B. Leistedt, J. D. McEwen, A. Pontzen
Spin-SILC: CMB polarisation component separation with spin wavelets
Congratulations to Hiranya Peiris who has shared this year’s $3 million Breakthrough Prize in Fundamental Physics for creating detailed maps of the early Universe. Hiranya worked as a PhD student on the NASA satellite known as Wilkinson Microwave Anisotropy Probe (WMAP), which helped shape our understanding of the origin, evolution and nature of the cosmos.
Read more about this on the main UCL news pages.
Hiranya was invited to give the 2017 Rosseland Lecture. The Rosseland Lecture is held annually by the Institute of Theoretical Astrophysics, University of Oslo, in memory of Norway’s foremost astrophysicist, and founder of the institute, Professor Svein Rosseland (1894 – 1985). The Rosseland Lecturers are internationally renowned, outstanding astrophysicists.
Congratulations also due to both Daniela Saadeh and Robert Schuhmann on their graduation! We are thrilled to announce that Daniela was also awarded the 2017 Jon Darius Memorial Prize which is awarded for outstanding postgraduate physics research in Astrophysics.
Robert Schuhmann and Daniela Saadeh with Hiranya Peiris on Graduation Day
And finally, last but by no means least, congratulations to Keir Rogers on successfully defending his thesis and his new position as Postdoctoral Fellow, Oskar Klein Centre for Cosmoparticle Physics in Stockholm!
Keir Rogers with Hiranya Peiris after successfully defending his thesis
Continue reading »
This post was written by Andreu Font-Ribera.
We live in a Universe that is expanding faster and faster, driven by a mysterious dark energy that amounts to 70% of the total energy density. However, it has not always been like this. The Baryon Oscillation Spectroscopic Survey collaboration has analysed the distribution of matter eleven billion years ago when the Universe was only one fourth of its current age, and we have shown that matter was the dominant source of energy at that time and the expansion rate was still decelerating.
An expanding Universe
The expansion of the Universe started at an extremely fast pace. During the second hour after the Big Bang the Universe doubled its volume! Since then, gravity has slowed down the expansion by pulling objects together, and during the last 50 million years — since an asteroid ended the life of most dinosaurs — the Universe has only increased its volume by 1%.
At the end of the last millennium however, two different groups reported that the Universe is not only expanding but the expansion rate is accelerating. What is causing the acceleration? Do we need to modify the laws of gravity? Is there something else in the Universe that is pulling galaxies apart? The short answer is: We do not know yet. In 1998 scientists started to use a placeholder for the answer, dark energy, and since then several experiments have been trying to figure out what it is.
To learn about the accelerated expansion of the Universe, we need to measure its size at different times. We could wait several million years and keep track of the growth of the Universe, but those eager for an answer can also look back in time and measure its size when it was younger. Due to the finite speed of light, photons that we receive from distant galaxies have been travelling for billions of years. Images of distant galaxies show us how the Universe looked in the past, and the farther we look at, the earlier in time we can reach.
Standard candles and rulers
The main challenge when studying the expansion of the Universe is how to measure cosmological distances. Our telescopes give us very accurate angular coordinates of galaxies, but it is not easy to tell how far they are. In the discovery of the acceleration of the Universe scientists measured distances using a technique known as standard candles. The flux measured from a given source decreases with the square of its distance. Therefore, if the brightness of a certain standard candle is known, one can estimate its distance by measuring its flux. The best standard candles to date are supernovae, a particular type of stellar explosion with a very regular brightness.

Standard candles and standard rulers allow us to measure cosmological distances. Credit: NASA/JPL-Caltech/R. Hurt (SSC).
An alternative technique, standard rulers, has recently provided the best distance measurements. The apparent size of a given object is inversely proportional to its distance. Therefore, if the absolute size of a certain standard ruler is known, one can estimate its distance by measuring its apparent size.
A particularly useful standard ruler is the Baryon Acoustic Oscillation (BAO), a characteristic feature in the distribution of matter, originated in the very early Universe. Soon after the Big Bang the Universe was a very dense and hot plasma, and the competition between gravity and pressure caused acoustic waves to propagate across the Universe. The Universe cooled down with the expansion, and 400,000 years after the Big Bang protons and electrons combined into atoms and caused the waves to stall. These acoustic oscillations left a subtle imprint in the distribution of matter at a scale corresponding to the distance that sound waves travelled during these 400,000 years. Since we know how to compute this distance using atomic physics, we got ourselves a standard ruler!
The BAO feature has been recently measured in the clustering of galaxies in the Baryon Oscillation Spectroscopic Survey (BOSS) , as described in this post by Marc Manera a couple of years ago. Using a catalogue of over a million galaxies, BOSS was able to measure the BAO scale very accurately and estimate the distance to the galaxies with a precision of 1%. Thanks to this measurement we can now confidently say that 5.97 +/- 0.06 billion years ago the Universe was one fourth of its current volume.
![The expansion history of the Universe is shown as a function of look back time. The black line is a prediction based on fitting cosmic microwave background data from the Planck satellite. It shows the Universe decelerating until roughly 6 billion years ago, when dark energy became the dominant energy component of the Universe and caused an accelerated expansion. The green data point shows a measurement of the current expansion, while the red data points show measurements using the BAO standard ruler in the clustering of BOSS galaxies. The blue data point shows the new BAO measurement using the Lyman alpha forest.]](http://www.earlyuniverse.org/wp-content/uploads/2017/03/Expansion_v2.png)
The expansion history of the Universe is shown as a function of look back time. The black line is a prediction based on fitting cosmic microwave background data from the Planck satellite. It shows the Universe decelerating until roughly 6 billion years ago, when dark energy became the dominant energy component of the Universe and caused an accelerated expansion. The green data point shows a measurement of the current expansion, while the red data points show measurements using the BAO standard ruler in the clustering of BOSS galaxies. The blue data point shows the new BAO measurement using the Lyman alpha forest.]
Even though this technique has been very successful, it is difficult to use it at even earlier times, because farther galaxies are too faint for our telescopes. If we want to study the expansion of the Universe before dark energy kicked in, we need to be creative and use an alternative method.
Quasars and the Lyman alpha forest
To study the expansion at earlier times, BOSS also observed hundreds of thousands of quasars, a special type of galaxy with an accreting black hole in the center. Quasars are hundreds of times brighter than normal galaxies, and this allows us to observe them even when they are far away. The light from the farthest quasar known to date has been travelling for over 13 billion years, so we see it as it was when the Universe was only 5% of its current age.
Some of the light from these distant quasars is absorbed by hydrogen atoms that it encounters along the path towards Earth. This is illustrated in the YouTube video below, courtesy of Andrew Pontzen. This phenomenon known as the Lyman-α forest, allows us to map the distribution of gas in the distant Universe.
When we analysed the absorption patterns in quasar spectra from BOSS we were able to detect the BAO feature in the distribution of intergalactic hydrogen and measure the expansion of the Universe eleven billion years ago. This result, shown as a blue data point in the figure above, confirms that the Universe was indeed decelerating at that time and was still dominated by matter. The final results from the BOSS survey are published in Bautista et al (2017, accepted for publication in Astronomy & Astrophysics).
The future: Dark Energy Spectroscopic Instrument
University College London is one of the founding institutions of the Dark Energy Spectroscopic Instrument (DESI), an international collaboration that from 2019 to 2024 will increase the size of current spectroscopic data sets by an order of magnitude, and will provide an unprecedented measurement of the expansion of the Universe. We are ready to learn more about the Universe, this is just starting!
You can read more here:
A.Slosar, A. Font-Ribera et al
The Lyman-alpha forest in three dimensions: measurements of large scale flux correlations from BOSS 1st-year data
J.E. Bautista, N.G. Busca et al
Measurement of BAO correlations at z=2.3 with SDSS DR12 Lyman-alpha forests
We are delighted to report that Daniela Saadeh’s PhD thesis has been selected as the winner of the 2017 Institute of Physics Gravitational Physics Thesis Prize!
The comments from the judging panel were:
“Daniela Saadeh’s thesis was unanimously chosen as the winner of this year’s IOP Gravitational Physics Thesis Prize. The judges found the presentation of the thesis to be outstandingly good, with clear figures, a good structure, and a concise and salient introduction to the subject matter. Together with her scientific achievements, this makes Dr Saadeh’s thesis a substantial and highly readable contribution to the literature on gravitational physics in cosmology.”
Daniela is thrilled to receive this prize and says:
“I’m extremely excited about receiving this prize! I want to thank my collaborators Stephen Feeney, Andrew Pontzen, Hiranya Peiris and Jason McEwen, with whom I’ve carried out the research underlying my thesis: we worked hard, had huge fun, and this feedback is just great!”
She previously summarised the main results of her thesis work in this blog post.
Daniela will be leaving to take up the position of Research Fellow in Late Universe Cosmology at the University of Nottingham in September 2017. We wish her all the best!
We are delighted to announce that Hiranya Peiris has been elected a Fellow of the American Physical Society (APS) in its announcement of the 2016 APS Honors!
In his letter to Hiranya, the President of the APS, Homer Neal, states:
“It is my pleasure to inform you that you have been elected Fellow of the American Physical Society (APS) by the APS Council of Representatives at its September 2016 meeting upon the recommendation of the Division of Astrophysics. The number of APS Fellows elected each year is limited to no more than one half of one percent of the membership. It is a prestigious recognition by your peers of your outstanding contributions to physics …. For significant contributions to the Wilkinson Microwave Anisotropy Probe project, Planck analyses, and the application of advanced statistical techniques to a wide range of astronomical data.”
Read all about it in the UCL Press Release!
Congratulations to Hiranya Peiris on her recent appointment to Director of the Oskar Klein Centre for Cosmoparticle Physics in Stockholm! Her new position means that Hiranya will be sharing her time (~50/50) between the Oskar Klein Centre and UCL for up to 5 years. Read Ariel Goobar’s welcoming post as the outgoing director.
With the end of session, we also say a fond farewell to several members of the team as they move on to pastures new; including Franz Elsner, Nina Roth, Michelle Lochner and Marc Manera, and also to Will Handley who joined us for a gap postdoc before embarking on a Junior Research Fellowship at Caius College, Cambridge.

Left to right: Franz Elsner, Boris Leistedt, Michelle Lochner and Michelle’s Mum!
One end of the table at the leavers lunch! Left to right: Will Handley, Andrew Pontzen, Hiranya Peiris, Franz Elsner, Boris Leistedt and Michelle Lochner.
… And here’s the other end! Left to right: Michelle Lochner, Michelle’s Mum, Daniela Saadeh, Bruno Moraes, Keir Rogers, Robert Schuhmann and Luisa Lucie-Smith.
Hiranya Peiris gave a lecture at the Royal Institution recently, on how over the past decade we have been able to answer age-old questions accurately, such as how old the Universe is, what it contains, and its destiny.
Join her as she unravels the detective story, explaining what we have uncovered, and how we know what we know!
This post was written by Daniela Saadeh.
This work has been published in Physical Review Letters today, and we are thrilled to note that the paper has been selected for Editors’ Suggestion! It has also featured in APS Physics and Science magazine, and in a UCL press release today!
The Standard Model of Cosmology relies on the fundamental assumption that we don’t occupy a special place in the Universe, an idea known as the Copernican Principle. After centuries of assuming humans were obviously at centre of the Universe, we got tired of being so egocentric!
‘Not in a special place’ is an idea that converts into the assumptions that the large-scale Universe looks the same everywhere, and as seen from everywhere; in particular, its properties don’t depend on position (a concept known as homogeneity) or direction (isotropy). However, assumptions must be tested. We can’t observe the Universe from other places (we are still sadly bound to the Earth and surroundings) but we can see what it looks like in different directions. Then we can decide how likely it is that the Universe is isotropic or not.
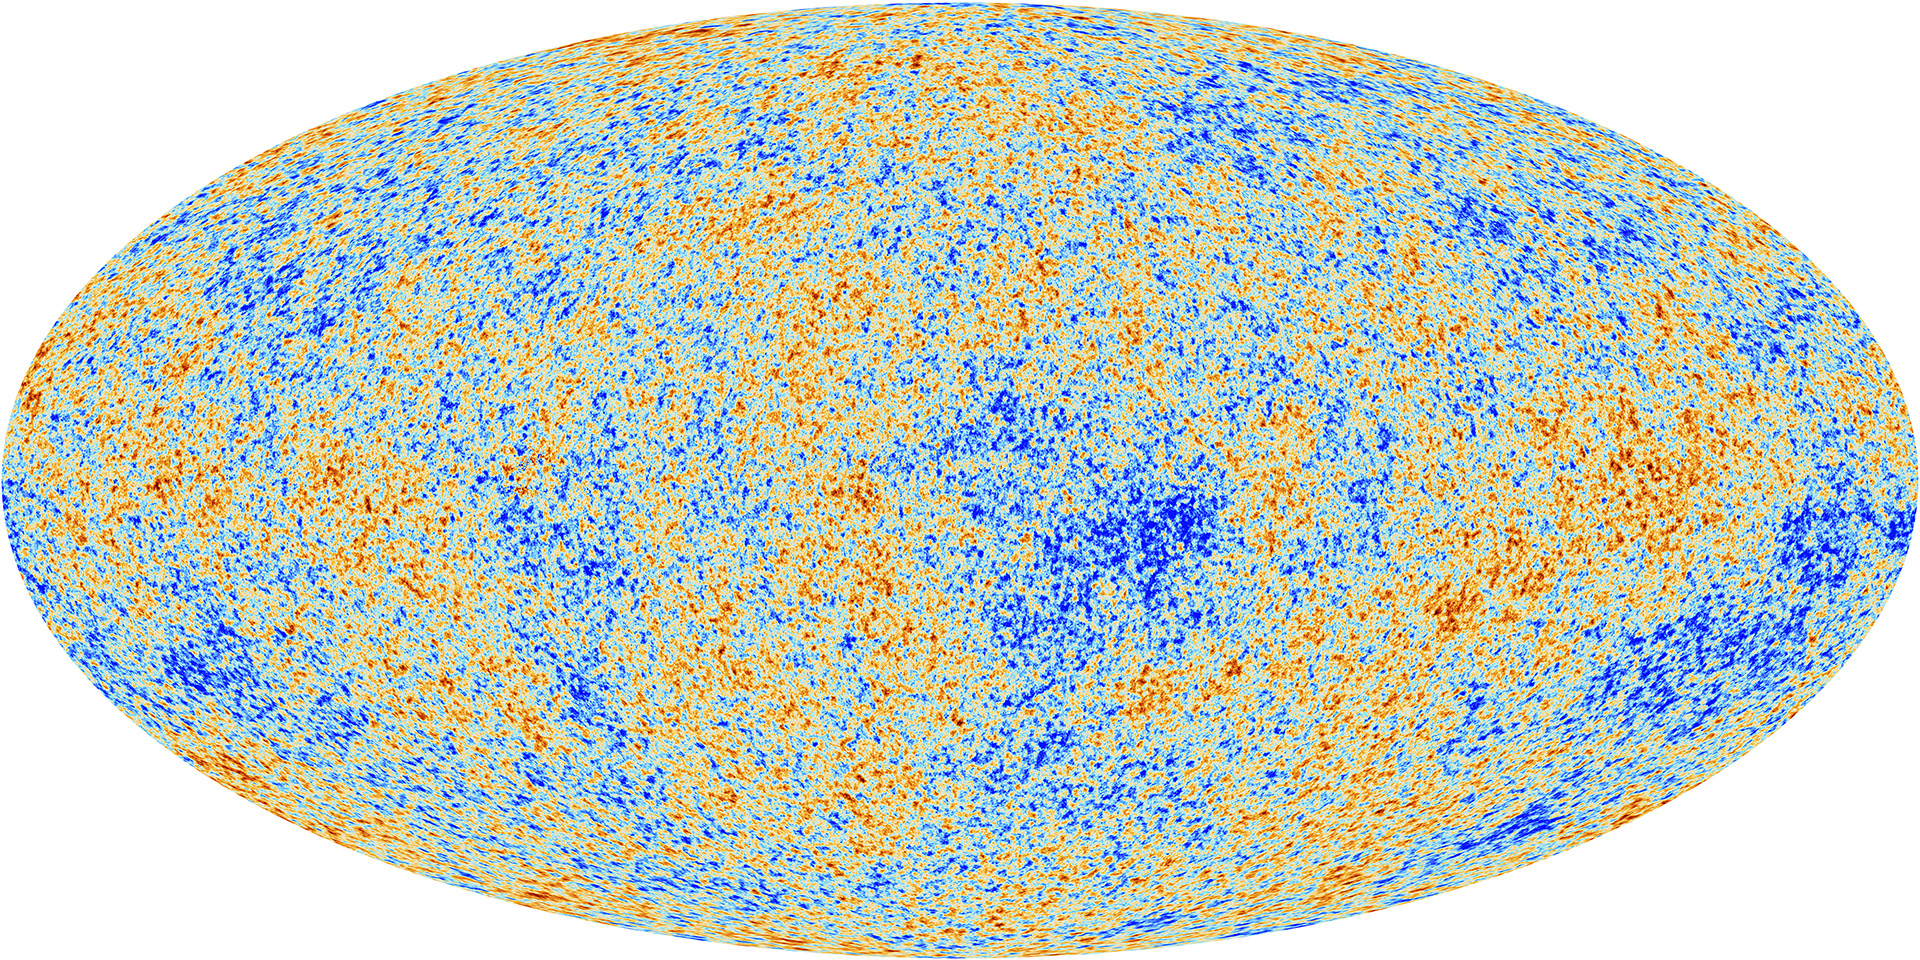
So we did just that and we had a go at putting the assumption of isotropy to the test. To do so, we analysed the Cosmic Microwave Background (CMB), a left-over radiation from the Big Bang that is basically a snapshot of the Universe when it was just 400,000 years old (compared to about 14 billion years now – a baby Universe indeed!). Looking this far allows us to probe very large scales, which is precisely what we needed to do.

Figure 1: The Cosmic Microwave Background (CMB) as seen by the Planck satellite. Credits: ESA and the Planck Collaboration.
Fortunately, we have amazing data from the Planck satellite with a wealth of quantitative information about the CMB temperature and polarization – what’s not to love?!
The isotropic picture
In a perfectly homogeneous and isotropic Universe the CMB would look likewise perfectly homogeneous and isotropic. However, during the very early phases of the Universe history (particularly, during a period known as inflation), this otherwise slightly boring picture was spiced up a bit and small perturbations were created in this smooth landscape in the form of curvature fluctuations. These incidentally, went on to form all the structure we know today – galaxies, clusters of galaxies, etc., and are the reason why we can exist today and discuss anisotropy! These perturbations can be studied by analysing the tiny temperature and polarization differences that were imprinted in the CMB as a result, which are represented as coloured blots in the CMB map in Figure 1. They are really tiny perturbations: 1 part in 100,000. As far as we can see, large-scale isotropy is at least, a very good approximation. As far as homogeneity is concerned, we can only comment on the portion of the Universe we see, but here large-scale homogeneity certainly seems to also hold.
In the standard picture, only these tiny fluctuations generated during inflation leave their imprint on the CMB. A distinctive feature is that some randomness is involved in their generation; their statistical behaviour is constrained by physics, but what exact perturbation will appear at a precise spot is random. If we were to make an analogy with a coin toss, we could say that physics chooses the coin, but the particular outcome of a toss is then random.
The anisotropic picture
What happens if isotropy is broken?
We considered the case where homogeneity is still preserved i.e. the properties of the Universe depend on direction, but in the same way in every place in the Universe. This is known as a Bianchi cosmology after the 19th century mathematician Luigi Bianchi (his precious 1898 paper is so old that is not even available in modern Italian!).
Let’s first see how the Universe can be homogeneous but anisotropic with a simple (very simple!) example. The animation below shows a fictitious homogeneous but anisotropic universe expanding at different rates in different directions, but the same way at every point. The triangle, square and circle are all deformed as a result but in the same way (in principle, the triangle could experience a different stretch from the circle). Let me stress this is only the simplest example; anisotropy can actually take much more complicated forms!
In such a Universe, the light making up the CMB is also stretched i.e. redshifted differently depending on the direction it is travelling. This means we could for example, see the light coming from north and 30º above the horizon as being redder (larger wavelength, more stretched) and that coming from west and 60º above the horizon as being bluer (lower wavelength, less stretched). In other words, this differential expansion will leave an imprint on the CMB.
So, in Bianchi cosmologies we will have two different types of CMB imprints: those generated during inflation discussed above, and the ones created by this intrinsic direction-dependence of the Universe. The big difference between them is that the latter can be predicted exactly, that is, it’s completely deterministic. For example, in a Universe expanding as in the animation above, the CMB would look as shown in Figure 2 below.
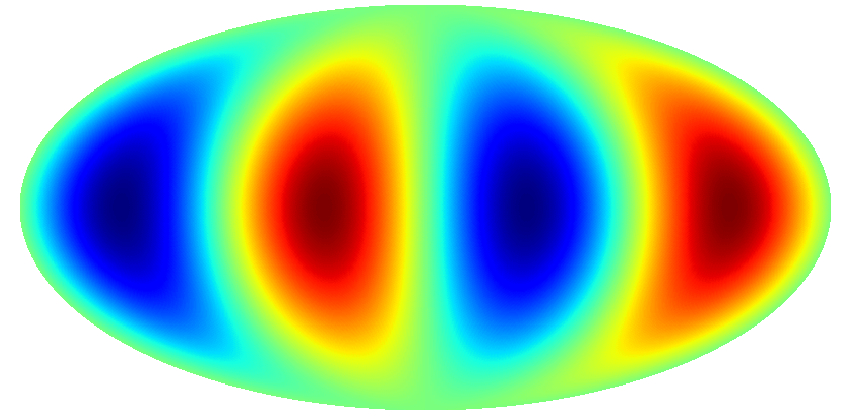
Figure 2: Imprint on the CMB for a universe expanding as shown in the animation above.
This was just a simple example. Moving away from the simplest picture, there are several ways in which the Universe can be anisotropic. In this website, you can see animations displaying how the CMB varies for some of these ways – for its visual aesthetics, I recommend this one!
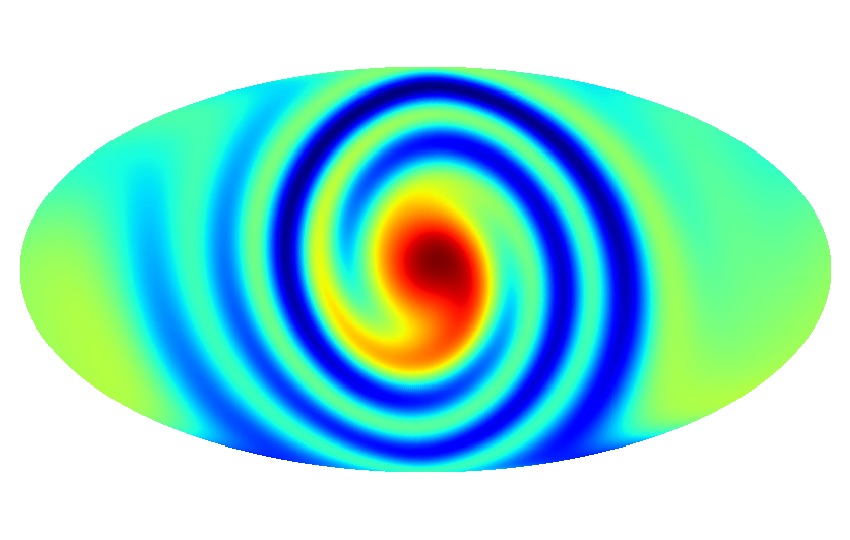
Figure 3: Example of a more complicated pattern that anisotropy can imprint on the CMB.
Looking for anisotropy
So, now we have discussed what anisotropy is, let’s discuss how we can go and search for it.
In his blog post, Jason McEwen discussed how Early Universe @UCL people had developed a rigorous Bayesian statistical analysis tool (called ANICOSMO) to search for signatures of anisotropic universes.
Briefly, ANICOSMO works as follows. First it needs a prediction of what the CMB will look like in a certain anisotropic universe (panel 1 in Figure 4). To do this, we have developed our own code called ABSolve, which can predict the pattern that Bianchi universes imprint on the CMB temperature and polarization. Then it needs to know the statistical properties of the perturbations generated during inflation (panel 2): for this we use the publicly available CAMB. ANICOSMO then puts these two bits of information together and obtains a prediction for the complete CMB sky after both anisotropy and inflation have done their job (panel 3). This simulated CMB is then compared with the real one and ANICOSMO can determine how much similar they look. This procedure is repeated for all the universes that are viable based on what we already know.
To carry out this study, we further expanded ANICOSMO (which is now known as ANICOSMO2) to analyse CMB polarization data as well as temperature. This signal is in fact, super precious because it has the most constraining information for anisotropy.

Figure 4: The imprint of anisotropy on the CMB is computed (1), then that of the perturbations generated during inflation (2). The two bits of information are put together, generating a prediction for the whole CMB sky in our model (3).
So is the Universe anisotropic?
No! The simpler picture wins! Our study disfavours anisotropic expansion of the Universe with odds of 121,000:1 against! (No bookmaker will give you that!)
After searching for all the possible ways that the Universe can be anisotropic, we concluded that there is not evidence for any of them. The Universe just appears to like all its directions the same!
Acknowledgements
Many thanks to Bruno Moraes for his helpful comments.
You can read more here:
D. Saadeh, S. M. Feeney, A. Pontzen, H. V. Peiris, J. D. McEwen
How isotropic is the Universe?
D. Saadeh, S. M. Feeney, A. Pontzen, H. V. Peiris, J. D. McEwen
A framework for testing isotropy with the cosmic microwave background
A. Pontzen, A. Challinor
Linearization of homogeneous, nearly-isotropic cosmological models
A. Pontzen, A. Challinor
Bianchi Model CMB Polarization and its Implications for CMB Anomalies
We are delighted to report that Hiranya Peiris has been elected to serve on the Royal Astronomical Society Council as Vice President (Astronomy) in the 2016 RAS elections.
Hiranya (who was also promoted to Professor of Astrophysics in the Astrophysics Group in the Department of Physics and Astronomy at UCL last year) says:
“I will aim to be a strong advocate for an inclusive Society that represents and supports the interests of the full range of demographics of its membership, and especially that of junior researchers.”
We are delighted to report that Boris Leistedt has been awarded the NASA Einstein Fellowship!

Boris left to take up a Simons Fellowship at New York University last year but remains a long term visiting fellow to the Early Universe group at UCL.
Boris says,
“I am thrilled to have been awarded a NASA Einstein fellowship, which will allow me to stay at New York University for three more years and realise an ambitious research programme in optimal conditions. I plan to take advantage of the stability and freedom offered by this fellowship to search for imprints of primordial physics in the large scale structure of the universe and also develop statistically accurate ways to test detailed models of galaxies and quasars using the large data sets that are or will be available in the next decade. In particular, I’d like to draw more connections between the various types of experiments, such as imaging surveys (DES, LSST), spectroscopic surveys (eBOSS, DESI) and others (SphereX, WFIRST). Given UCL’s involvement in these projects and the expertise of the Early Universe group, I will continue to visit London on a regular basis and be part of exciting collaborative projects.”
The Science and Technology Facilities Council (STFC) has confirmed the UK’s participation in the Large Synoptic Survey Telescope (LSST) in a press release this week.

The LSST is an international project that UCL astronomers including our very own Hiranya Peiris have been involved in since 2013.
Read all about it on the UCL Mathematical & Physical Sciences News page!

We are delighted to be able to report that in the Royal Astronomical Society announcement of the 2016 winners of its awards, medals and prizes, the Society’s 2016 Fowler Award for early achievement in astronomy has been made to our very own Andrew Pontzen!
Here is the Royal Astronomical Society citation of the award:
The Fowler Award for Astronomy is awarded to Dr Andrew Pontzen.
Andrew Pontzen is an exceptionally creative theorist. He has done important work in a number of different areas spanning the range from theoretical work on anisotropic cosmologies, numerical simulations of galaxy formation, through to the dynamics of dark matter halos. His work on the effects of supernovae feedback in flattening the inner density profiles of dwarf galaxies offers a solution to a long-standing problem of the Cold Dark Matter model. In recognition of his unusual combination of analytic ability, computational skills and originality, Andrew Pontzen receives the Fowler Award of the Royal Astronomical Society.
Congratulations to Andrew on this phenomenal success!
This blog post was written by Andrew Pontzen.
Come trick-or-treating at my house and you’ll be treated to little more than an icy stare. In my book, the only good thing about Halloween is its ability to hold back the tidal wave of commercial Christmas tat that floods shops in November. Let’s face it, the most famous ghost of Hallowe’en is the mysterious apostrophe that died under suspicious circumstances in the 1990s, yet is still occasionally sighted floating through the word.
Most years, Early Universe @ UCL gang members can be found out on the streets of London, terrorising law-abiding citizens into giving up sweets, cakes and bubble universes. But with the departure of notorious enforcer Leistedt to the meaner streets of New York, this time the leadership has taken a softer stance and members have instead been carving out new niches in the traditional pumpkin competition.
Runner-up is Hiranya’s Einstein homage, which I like to think was carved using “spooky action at a distance”:
But the winner is newcomer Luisa Lucie-Smith with a Churchillian masterpiece:
A last-minute appeal to the judges objected that carrots are contraband. The appeal has been denied.
This post was written by Michelle Lochner.
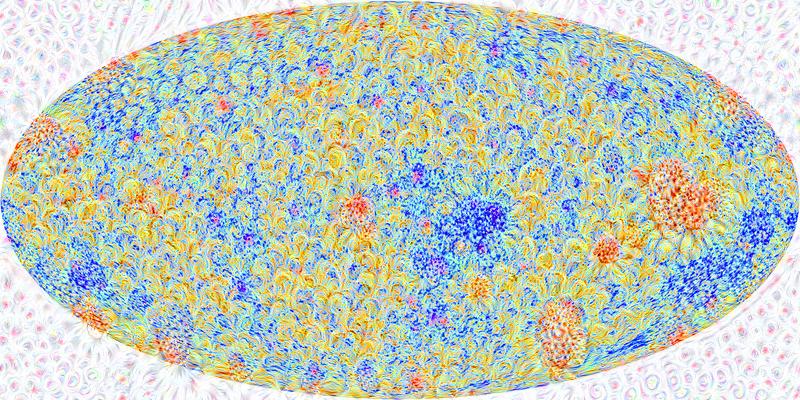
A few months ago, Google made headlines when they released images of “dreams” from their image recognition neural network. In a process they called “Deep Dreaming”, the neural network could turn any normal image into a fantastical dreamscape, all generated from things the network has seen while training. I decided to experiment with Google’s publicly available deep dreaming tools and asked the question, what does the CMB look like when the network dreams about it? This post below is reproduced from my research blog, http://doc-loc.blogspot.co.uk/.
You may have heard about Google’s Deep Dreaming network, turning completely normal pictures of clouds into surreal cityscapes.
I was curious about what would happen if I asked the network to dream about the cosmic microwave background (CMB), the baby photo of the Universe. The CMB is the background radiation left over by the Big Bang and is one of the most important probes of the Universe that we have. As a pattern, it looks pretty close to noise so I had no way of knowing what might come out of Google’s dreams.
What is Deep Dreaming? Well this all came from the desire for search-engine giant Google to solve the image-recognition problem. This is a good example of something that humans do very easily at just a few weeks of age, but is notoriously difficult to get a computer to do. However, Google does seem to be cracking the problem with their deep learning algorithms. They’re using convolutional neural networks, which are neural networks with many layers. So it seems Google has had the most success with a machine learning algorithm that tries to imitate the human brain.

Deep Dreaming is what I suspect the people at Google came up with while they were trying to understand exactly what was going on inside their algorithms (machine learning can be a dark art). The original blog post is excellent so I won’t repeat it here but will rather show you what I got when playing around with their code.
You can actually submit any image you like here and get a ‘inceptionised’ image out with default settings, but I wasn’t happy with the result (the default settings seem optimised to pick up eyes) so I decided to dig deeper. For the technically inclined, it’s not that hard to run your own network and change the settings to get the strange images in Google’s gallery. Everything you need is on the publicly available github repository, including a great ipython notebook for doing this yourself.
The CMB as seen by Planck
I took a (relatively low-resolution) image of the CMB from the Planck satellite to test the deep dreaming methods on. Basically all of the DeepDream images are produced by picking something and then telling the neural net to try and make the input image as close to that thing as possible. It’s the something you pick that will change the images you get out.
Google’s trained convolutional neural network is over a hundred layers deep, each layer corresponding to some particular things the network has seen in the training set. When running the network on an image, you can pick out one of the layers and enhance it.
Picking out higher level layers tends to bring out smaller, more angular features whereas lower levels tend to be more impressionistic, smoother features.
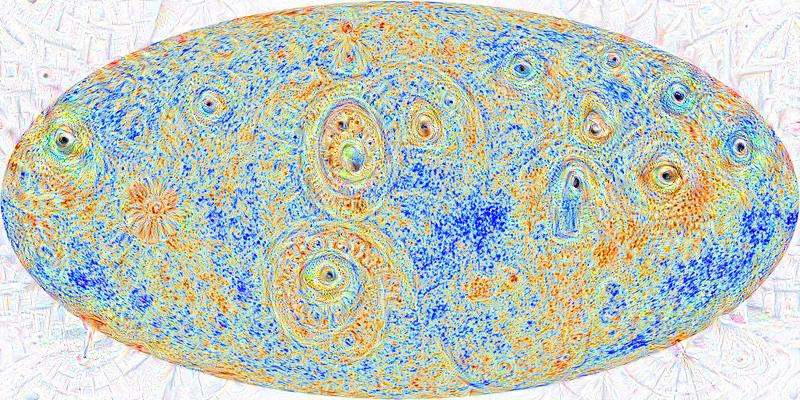
Low level layer – more impressionistic features
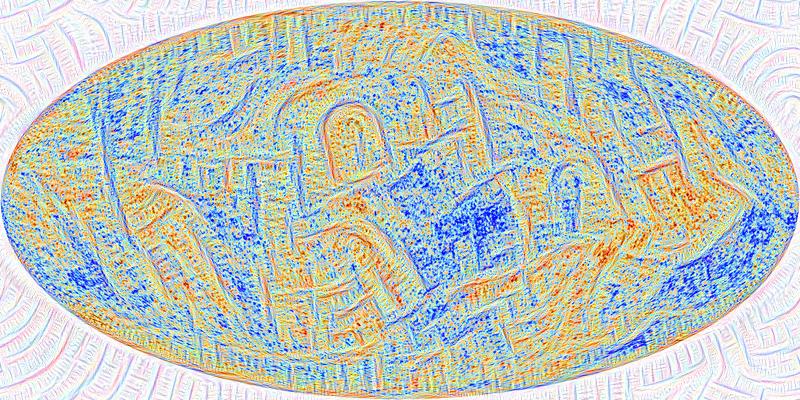
High level layer – more angular features
Then you can also ask the network to try and find something particular within your image. To the technically inclined, this is equivalent to placing a strong prior on the network so that it optimises for a particular image. In this case, I asked it to find flowers in the CMB.

“Guide” image
Generated image
Now comes the fun stuff. You ask the network to generate an image as before, focusing on a specific layer. Then you take the output image, perform some small transform (like zooming in a little) and run it again. This is Google’s dreaming. You can start with almost any image you like. Playing around I eventually found “the dog layer” where it continuously found dogs in the sky.
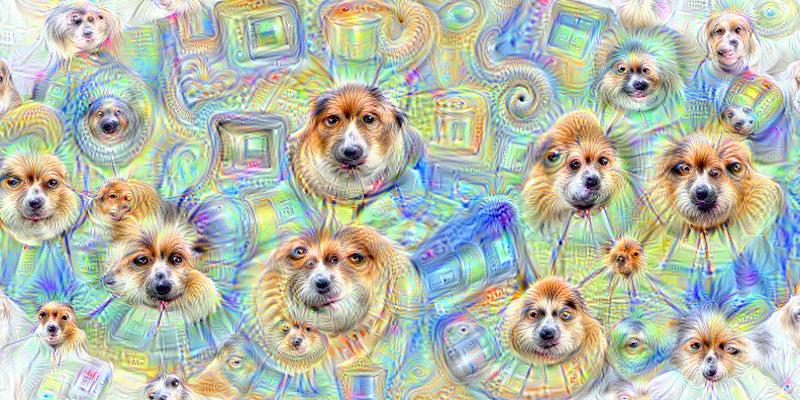
The CMB very quickly goes to the dogs!
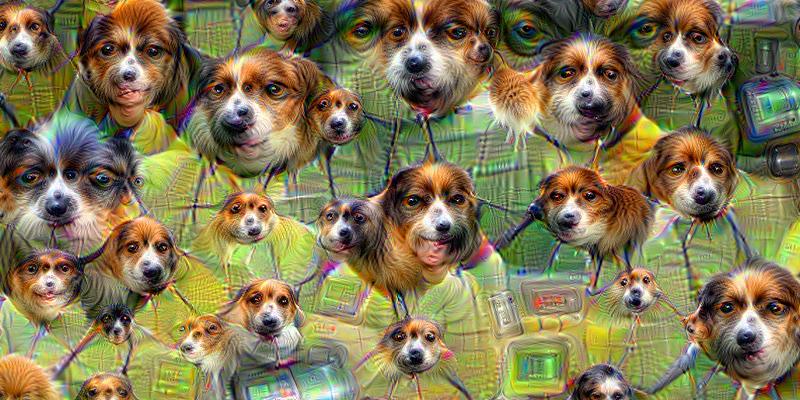
After a while it starts finding microwaves too
I made a video of a few hundred iterations of this (note: I lengthened the first few frames otherwise they go by way too fast). I find it really appropriate that after a while, it starts finding what really looks like a bunch of microwaves, in the cosmic microwave background radiation… Enjoy the show!
As usual at this time of year we have to bid farewell to some familiar faces in the Early Universe @ UCL team, and also welcome some new faces!
We bid a fond farewell to Boris Leistedt as he takes up a new position as a Simons Fellow at New York University. It isn’t goodbye however as Boris will return regularly as a long term visitor to the group, and will continue to contribute to this blog!
We also say goodbye and good luck to Aurélien Benoit-Lévy as he takes up a CNES postdoctoral fellowship at Institut d’Astrophysique de Paris.
Last but not least, we welcome our new PhD student Luisa Lucie-Smith. Luisa did her MSc in Quantum Fields and Fundamental Forces which focussed on theoretical high-energy physics, and her BSc in mathematical physics. She therefore has a strong mathematical/theoretical physics background, and we look forward to her upcoming blog posts!
The summer has brought some well-deserved recognition for EarlyUniverse.org researchers!
Nina Roth received the best poster prize at a major summer symposium held at the European Southern Observatory headquarters in Garching, Germany, titled “Theoretical and Observational Progress on Large-scale Structure of the Universe”.
Nina says,
“I really enjoyed the conference and my collaborators and I are honored by the recognition for our project. The selection committee certainly had a tough decision to make when choosing between ~60 excellent posters. I was especially delighted to receive an ESO shirt as part of the prize, because I collect university-themed clothing!”
Daniela Saadeh has received the 2015 Physics of the Dark Universe Award at the conference “From Inflation to Galaxies: a workshop in honor of Sabino Matarrese”, which came accompanied by a fun giant cheque!

Daniela says,
“The conference was a very friendly place for a young person to speak and I could give free rein to my enthusiasm and excitement. There were very good talks, so I feel honoured and extremely happy about this award, especially because it comes after a lot of hard work!”
Meanwhile Boris Leistedt, whose thesis previously won a prize from the Royal Astronomical Society, has been given a nice parting present from UCL as he begins his new position as a Simons Fellow at New York University. He has been jointly awarded the Jon Darius Memorial Prize for 2014/15, for Outstanding Postgraduate Research in Astrophysics.
Boris Leistedt’s PhD thesis (“Accurate Cosmology with Galaxy and Quasar Surveys”) has been named runner-up for the Michael Penston Prize 2014, awarded for the best doctoral thesis in astronomy and astrophysics. Boris says:
“I am honoured to be the runner-up for the Michael Pentson Prize 2014. It took me by surprise given how competitive this prize is, but I am delighted to see that my thesis convinced the selection committee at the Royal Astronomical Society. I am also pleased to perpetuate a UCL tradition started by Stephen Feeney and Emma Chapman, who both did their PhD in the UCL cosmology group and were named runner-ups for the same prize in 2012 and 2013. Go UCL!”
Boris will be taking up a Junior Fellowship of the Simons Society at New York University in September 2015. We wish him all the best!
The European Research Council project CosmicDawn has passed its mid-term milestone, and the mid-term report has just been approved by the ERC! Led by Hiranya Peiris, the CosmicDawn team funded by the ERC during this reporting period consisted of postdoctoral research fellows Jonathan Braden, Franz Elsner, Boris Leistedt, and Nina Roth, as well as undergraduate intern Max Kerr Winter.
The CosmicDawn team is using the Planck and Dark Energy Survey (DES) data to rigorously test the theory of inflation, the dominant paradigm for the origin of cosmic structure, and to seek signatures of new physics that are likely to exist at these unexplored energies. Our aim is to go beyond simply testing generic predictions of the inflationary paradigm, to gain a fundamental understanding of the physics responsible for the origin of cosmic structure. In working towards this goal, the team has focused on: (1) theoretical modelling at the cutting edge of fundamental physics (describing not just the inflationary period but also pre- and post-inflationary physics); (2) development of powerful wavelet and filtering techniques to extract these physical signatures; (3) introduction of CMB techniques new to LSS analyses to facilitate major sensitivity gains; (4) use of advanced Bayesian statistical methods to extract reliable information from the data; and (5) a deep understanding of data limitations and control of systematics. Over the reporting period, our research has led to 74 publications, including interdisciplinary papers with high energy theorists and numerical relativists, and cross-disciplinary papers in information engineering and high performance computing.
This post was written by Jonathan Braden.
NOVA’s The Nature of Reality recently dedicated a blog post to my work on bubble collisions with J. Richard Bond and Laura Mersini-Houghton. The post focussed on one possible observational consequence of our findings. Here I’ll outline a little more precisely what we did in our work. For more information see my webpage.
Inflation, Bubble Universes and the Multiverse
Modern cosmology posits that the very early universe underwent a period of rapid expansion known as inflation. Inflation smoothes out the cosmos, creating the large-scale homogeneity we observe today, while simultaneously leaving small wrinkles that eventually form structures such as galaxies. However, it turns out that once inflation begins it may continue forever. In this ‘eternal inflation’, an omniscient being able to view the entirety of the universe at once would see vast swathes of space continuing to inflate. Only in special pockets has inflation ended, allowing structures such as galaxies to form and life as we know it to exist. This large collection of “pocket universes” is one incarnation of the multiverse.
Two mechanisms may cause eternal inflation, both of which can be visualized by thinking about a ball rolling down a mountain. The multiverse can be pictured as many copies of this mountain, each located at a different point in space and each with its own ball. New space is created in regions that are inflating, so the mountains in these regions replicate to fill the rapidly expanding space. The rate at which space is being created, or how quickly a given mountain replicates, is determined by the height of the ball above sea level. When a ball approaches the bottom of a mountain, inflation ends in that region. The mountains aren’t completely smooth: there are many ridges, long valleys and depressions along the way, which affect the ball’s trajectory and determine how long it takes to reach the base. There are also regular wind gusts that get stronger as we climb higher up the mountain. The mountaintop is extremely windy, while the base is calm. The wind represents the effects of quantum mechanics on the rolling balls and is produced by inflation. The strength and direction of the gusts varies from mountain to mountain. However, each individual gust affects a large spatial volume and thus pushes the balls on several different mountains at the same time.
In one type of eternal inflation, which I’ll call stochastic eternal inflation, the wind is so strong that it can push the ball back up the mountain. Balls that move up the mountain then replicate, so that there are always some balls that remain trapped near the top of the mountain, i.e. some regions of space are always inflating.
In the second type of eternal inflation, called false vacuum eternal inflation, the ball instead rolls into a depression and gets stuck. Without quantum mechanics, this would be the end of the story and the ball would sit there forever. However, the ball may escape in two different ways. In one case, the wind is strong enough to blow the ball out of the depression and it once again starts rolling down the hill. In the other case, the depression is so deep that the wind can’t extract the ball from it. However, there is another quantum mechanical effect. As an (imperfect) analogy, suppose that thunderstorms occasionally pass over the mountain and the rain fills the depression so that it forms a pond. Eventually the pond overflows and the ball escapes with the water to once again start rolling down the mountain. In physics lingo, the region has quantum mechanically tunnelled out of the depression. The thunderstorms are more localised than the wind gusts, so the regions that tunnel are smaller than the regions blown around by the wind. In the actual universe these tunnelling events correspond to the creation of new bubble universes.
In this final scenario, the universe on very large scales looks like a pot of boiling water, with a universe like our own existing within each of the bubbles of steam. The water in this case has the strange property that it is continually expanding and replenishing itself, so that the pot of water gets larger and larger. As a result, new water is constantly becoming available to nucleate new bubbles. Once in a while two bubbles will nucleate close enough to each other that they run into each other as they expand. From our viewpoint living within one of the steam bubbles, it looks as though our universe has collided with another universe.
Symmetric Collisions
Previously, physicists have always assumed that if we were to videotape a collision between two bubbles, then the video would look exactly the same if we spun the video camera around in certain ways or if we jumped in a car and drove away from the two bubbles at a constant speed in certain directions. To use a physicist’s favourite word, the collision is said to possess a large amount of symmetry. The symmetry is really a combination of two different types of symmetries: a rotational piece and two boost pieces. These correspond to rotating our video camera and driving away in a car, respectively. To visualize the rotational part, first imagine that each bubble is a perfectly spherical ball. In a collision we have two balls, so imagine connecting the two bubbles by a thin string to make a barbell. After nucleating, each bubble expands so the length of the string decreases with time until eventually the bubbles collide. Now, if you grab one ball in each hand and rotate the whole thing around this string, the collision will look exactly the same. The boost symmetry is a little bit stranger, but basically if you took one ball in each hand and threw them away from you at the same speed and with their centres parallel to each other, then the resulting collision will be the same regardless of how fast you throw the two balls.
When we make these symmetry assumptions, then we often get collisions that look like the figure below. To visualize what’s going on, think of each bubble as a rubber ball that is being inflated while its center is held fixed. As they are inflated, each ball gets bigger and bigger, just like a balloon. Eventually the balls become large enough that they hit each other. When the rubber walls of the balls collide, they bounce off of each other, making a dent. These dents then spring back out and bounce off each other again, and the whole process repeats. A video illustrating this can be seen in the YouTube link below.
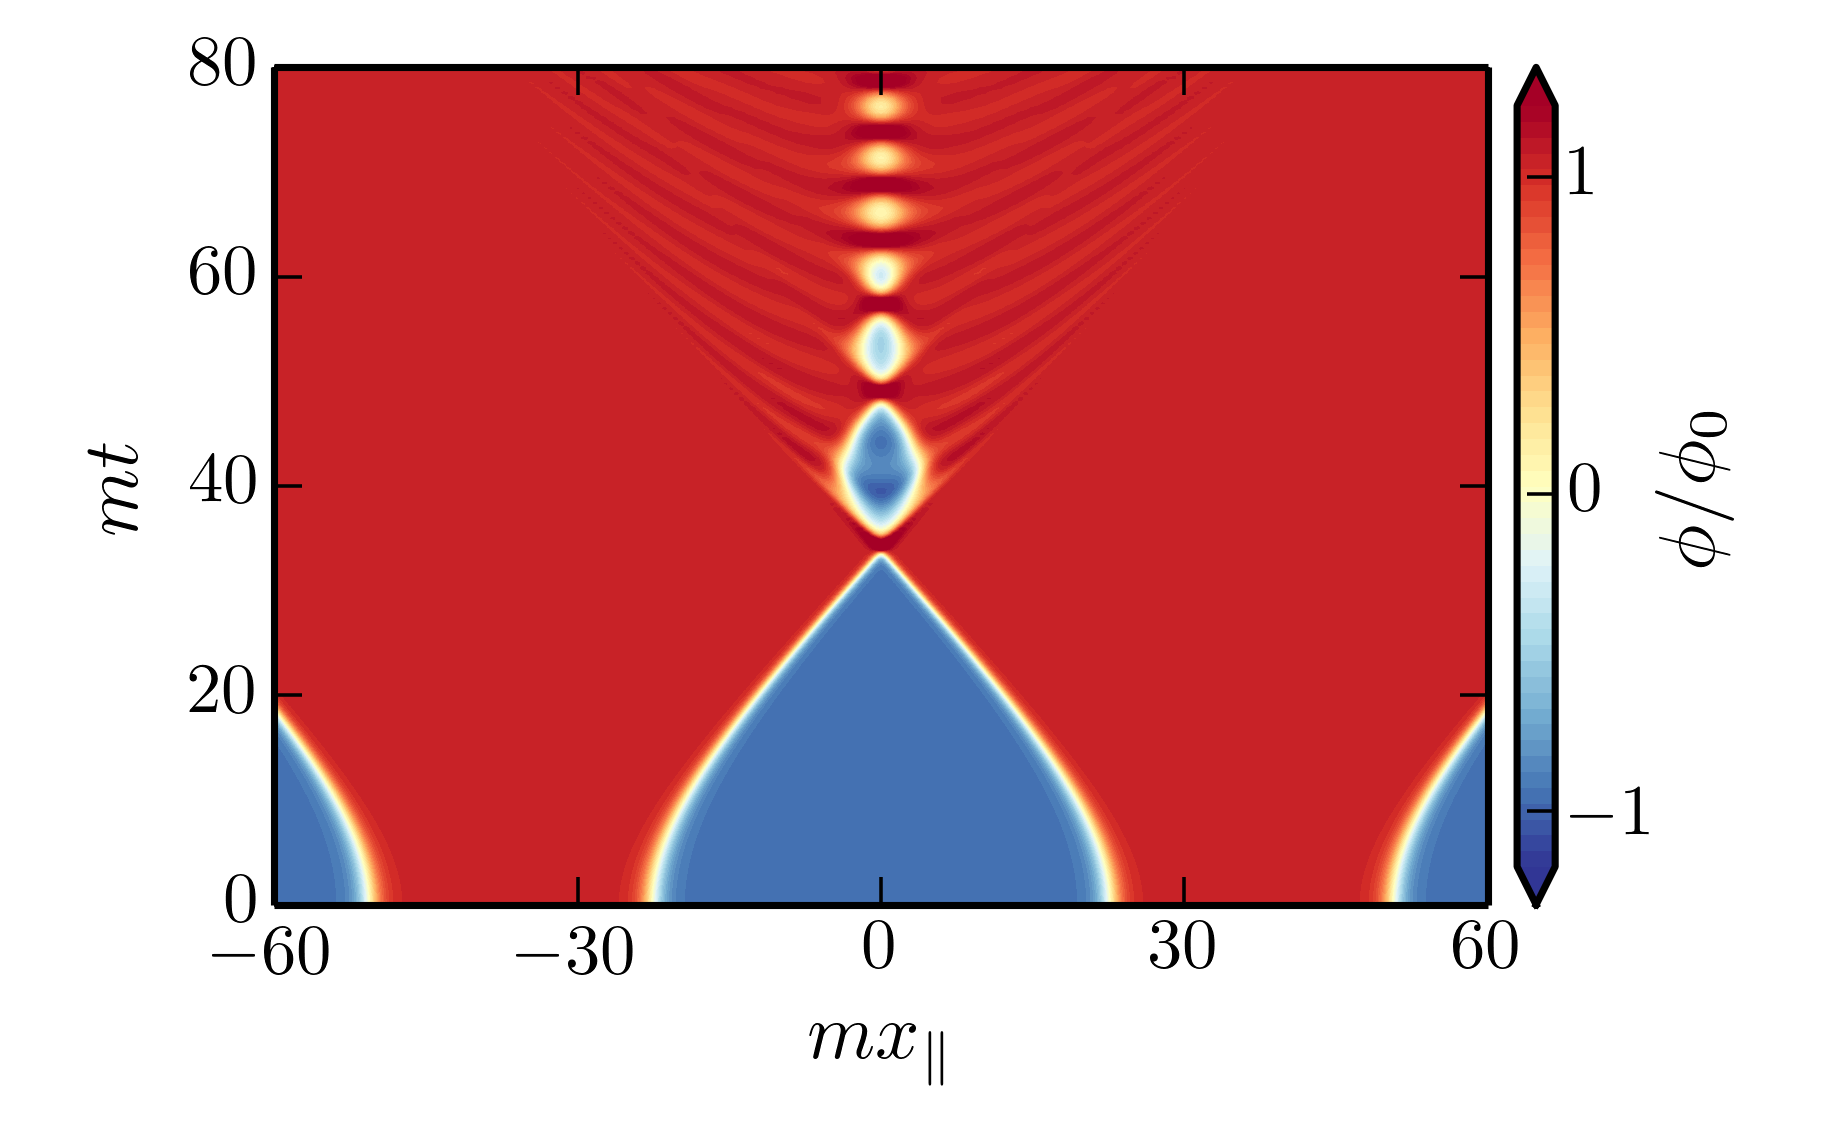
Figure 1: Collision between two bubbles assuming the rotation and boost symmetries described in the main text. The horizontal axis measures position along the barbell string (see analogy in the text above) and the vertical axis measures time since nucleation of the bubbles. Red is inside the bubbles, blue is outside the bubbles, and white shows the location of the bubble walls.
Collisions with Quantum Mechanics
However, the situation described above isn’t the full story. Thanks to quantum mechanics, there is inevitably some jitter around the perfect spheres. To use the same analogy I gave in the article, imagine that each bubble is a globe with small bumps and ripples from the various land masses, mountains, and valleys. If we spin the globe around, the positions of the continents, oceans, and mountain ranges change so that it no longer looks identical when viewed from different directions. Once again using a physicist’s language, we say the symmetry has been broken.
As I mentioned, these mountain ranges and valleys must be present, or else we would be violating the laws of quantum mechanics. However, they also serve two much more practical purposes in the inflationary multiverse: the bubbles nucleate because of the quantum jitter, and the quantum fluctuations eventually form all of the galaxies and other structure that we see in the universe around us. Therefore, the entire picture of our observable universe living within a bubble nucleated in a much larger multiverse relies heavily on this quantum jitter.
In our series of papers (here, here and here) we studied the effects of this quantum jitter on bubble collisions. When the bubbles first nucleate, the fluctuations are small and you would have to look very carefully to see that the bubbles are not perfect spheres. Again viewing each bubble as a globe, you would need to pull out a magnifying glass in order to see that there are small mountains on the surface. However, it turns out that the collisions of the bubbles can make the jitter grow very fast. In the figure below, I’ve illustrated the difference between having no quantum jitter (left panel) and small initial fluctuations (right panel). The collision with the initial jitter is seen in the YouTube video below. The mountains (valleys) on the parts of the globes that dent in and out during the collision quickly grow in height (depth). In other words, mountain ranges grow on the parts of the walls that continually bounce off of each other. The first few times the bubble walls bounce off of each other, the mountains are still small so things look basically the same as if the bubbles were perfect spheres. However, it doesn’t take long for the mountains to get very high (much higher than Mount Everest). In the next collision, rather than the walls of the balls bouncing off of each other, the mountains instead poke holes in the bouncing walls. The walls quickly dissolve, leaving behind some small remnants in the collision region.

Figure 2: Here we show the distribution of energy for both a collision with no quantum jitter (left) and a collision with quantum jitter (right) at a point after the initial quantum fluctuations have become very large as a result of the collision. Quantum mechanics dramatically changes the final outcome of the collision.
New Phenomenology and Future Work
As seen in the figures and videos above, including quantum fluctuations can significantly alter the outcome of bubble collisions. This forces us to re-evaluate our current understanding of bubble collisions in the multiverse. Two of the more exciting possibilities are the production of gravitational waves during the pairwise collisions of bubbles, and the creation of black holes from the collisions. In the treatment based on rotational and boost symmetries, both of these effects are ignored because the symmetry assumptions forbid them from occurring. The former of these effects was emphasized in the NOVA post on our work, and it could provide a new observational signature from bubble collisions in the multiverse. This is very exciting, since this could give us an additional observational handle with which to test the multiverse.
Acknowledgments
A big thank-you to Belle Helen Burgess and Hiranya Peiris for editing and comments.
You can read more here:
NOVA blog post
Gravitational Waves from Bubble Universe Collisions?
More on bubble universe collisions
- Eternal Inflation and Colliding Universes
- The World Inside a Bubble
- Simulating Cosmic Bubble Collisions in Full General Relativity
J.R. Bond, J. Braden, and L. Mersini-Houghton
Cosmic bubble and domain wall instabilities III: The role of oscillons in three-dimensional bubble collisions
J. Braden, J.R. Bond, and L. Mersini-Houghton
Cosmic bubble and domain wall instabilities II: Fracturing of colliding walls
J. Braden, J.R. Bond, and L. Mersini-Houghton
Cosmic bubble and domain wall instabilities I: Parametric amplification of linear fluctuations
Photograph by Boris Leistedt
In honour of International Women’s Day, in this blog post UCL women who work on the Dark Energy Survey (DES) talk about what most excites them about their research on DES!
The Dark Energy Survey is designed to probe the origin of the accelerating universe and help uncover the nature of dark energy by measuring the 14-billion-year history of cosmic expansion with high precision. More than 120 scientists from 23 institutions in the United States, Spain, the United Kingdom, Brazil, and Germany are working on the project. This collaboration has built and deployed an extremely sensitive 570-Megapixel digital camera, DECam. This new camera has been mounted on the Blanco 4-meter telescope at Cerro Tololo Inter-American Observatory, high in the Chilean Andes.
Starting in August of 2013 and continuing for five years, DES has begun to survey a large swathe of the southern sky out to vast distances in order to provide new clues to this most fundamental of questions.
UCL hosts a large group of researchers contributing heavily to DES, and the optical corrector for the survey camera was built here. You can read more about DES @UCL here.
Left to right: Antonella Palmese, Dr Stéphanie Jouvel, Dr Hiranya Peiris, Lucinda Clerkin. The backdrop is the John Flaxman Gallery under the dome of UCL’s main library, overlaid with the CCD mosaic pattern of the DECam footprint.
DES@UCL women in their own words:
Antonella Palmese (PhD student): “DES is not only about Dark Energy. DES is much more: what strikes me the most is the fact that we can discover so many different things with it. When I joined the collaboration one year ago, I would have never expected to work on such a wide range of topics: from the distribution of mass in clusters of galaxies, to the redshifts of the galaxies, to the stars.”
Dr Stéphanie Jouvel (postdoctoral research fellow): “I’m working on photometric redshift systematics: how to get a reliable estimate of the radial distance between our galaxy and galaxies we observe in DES. Spectroscopy being time-intensive and expensive, we have to rely on some photometric bands to get a rough idea of the distance. The distance will then be incorporated in the weak-lensing mass maps or large scale clustering to understand the evolution of structures in the Universe as we go back in time.”
Dr Hiranya Peiris (faculty): “While DES was designed to uncover the secrets of Dark Energy, it is also a huge galaxy survey, mapping an unprecedented volume of the Universe with exquisite precision, so the range of DES science is immense. I am working on using DES data to test fundamental physics, but also to understand astrophysics: how do galaxies form and evolve, and how are they connected to the underlying “scaffolding” of dark matter? I am most excited about answering these questions by combining DES data with other big datasets, such as the cosmic microwave background.”
Lucinda Clerkin (PhD student): “I’m looking at the relationship between dark matter and the stuff that we can see, using galaxies observed by DES along with reconstructed mass maps from weak gravitational lensing. This relationship is an important ingredient in calculations of the make-up and evolution of the Universe, and therefore in figuring out what dark energy is – or indeed if it exists! I’ve also been lucky enough to spend an awesome week observing for DES at the Blanco telescope in Chile.”
We are very pleased to announce that there is a new Doctor in the house! Boris Leistedt passed his PhD viva titled “Accurate Cosmology with Galaxy and Quasar Surveys” with flying colours. We also celebrate Boris’s success in the recent postdoctoral job season: having received offers of several prestigious fellowships in the USA and Europe, Boris has decided to take up a Simons Fellowship at New York University to continue his highly innovative work in survey cosmology. Congratulations and best wishes to Dr. Leistedt!
The newly-minted Dr. Leistedt with thesis examiners Prof. Alan Heavens (right) and Dr. Benjamin Joachimi (left) after a successful viva.
Three academic generations: Hiranya Peiris and Jason McEwen with the new Dr Leistedt, former PhD student Dr Stephen Feeney, and new PhD student Keir Rogers, at the PhD celebration.
This guest blog post was written by Layne Price.
I’ll let you in on a little secret about inflation: we don’t know really know any of the details. This might or might not be surprising to you, but it’s not often advertised — although it does keep us working hard!
Let’s start with what we do have: a nice and simple understanding of a basic inflationary mechanism, which has lots of successes — namely, flattening, smoothing, but ever-so-slightly wrinkling our universe. These are things that we do observe and that most people agree we don’t have a satisfactory description for, outside of invoking inflation.
So, what’s the problem?
This simple understanding falls well short of what is actually going on. Inflation happens during a complex era of the universe’s history, which has energies that vastly exceed anything we will likely ever be able to test in a laboratory. Importantly, we do not have an experimentally confirmed theory that we can study for clues at this energy scale, since physics’ workhorse, the Standard Model, breaks down spectacularly.
Consequently, the inflationary models we use are by-and-large “toy” descriptions of something realistic, but beyond our current reach. What I mean by this is that we try to pare down a complicated theory by ignoring possible features it might contain until we are left with only the bare essence of what we need in order to get inflation. We then study this overly simplistic toy model because it’s easier and captures the most important details.
Unfortunately, while this is simple (and Ockham would certainly approve), these toy models have been found lacking. The most obvious problem is that the simplest of all possible models — inflation driven by one single massive field — is under very serious pressure from the Planck satellite, since it predicts more gravitational waves than we can reconcile with the observations of the cosmic microwave background (CMB).
So, if the simplest models don’t work, what are we supposed to do? Let’s say we want to cook up a better inflation model. To start with, we first want to find some sort of exotic material to drive inflation, but there’s nothing obvious in the standard theories. OK, then — what non-standard ingredients do we have? A typical roll-call from high energy theories goes something like this: supergravity; Type I, Type IIa, Type IIb, and heterotic string theories; modified gravity; compactifications of extra dimensions into a high-dimensional landscape; a buffet of supersymmetric extensions to the Standard Model; axions, instantons, galileons — and this just scratches the surface. It’s confusing and unlikely that we will all come to an agreement about exactly which ingredients are right.
However, what each of these theories gives us is the freedom to add lots of new knobs and dials we can play with to tease out a combination of parameters that gives us something sensible. With a complicated enough machine hooked up to the toy models, it’s not so surprising that we can tune it to find lots of interesting things that match the data very well.

The toy picture of inflation has only a few dials we can turn. However, if we hook it up to the high energy Franken-machine, there are almost endless possibilities.
So, now we ask ourselves, “Do we find this approach convincing?” If we were to include everything in the fridge in our recipe, weigh all our ingredients precisely, cook the theory just right, and get a great new scenario, would you believe it? We may be very fond of the exact combination of knobs and dials we tuned to predict the data, but of course there is nothing to guarantee that this is what actually happened in the real Universe – many different settings could have led to the same outcome!
Luckily there’s something we can do so that we don’t have to have a complete understanding of the high energy theory. Suppose we have an inflation model with one parameter X, and we need X to get a prediction, which we’ll call Y, from the model. Inflationary parameters might be things like a quantum field’s mass or initial conditions; and, as we discussed above, realistic models have many parameters. But, we’ll use X as a placeholder in a general model.
It’s common that we don’t know what the exact value of X is. High energy theory is notoriously hard, after all. So, it’s typical to quit and leave the problem here, since we’re now stuck: we don’t know X, and Y depends on X, so we need more info. However, we do have some extra information floating around somewhere; we just need to gather it.
Let’s collect what we do know in this hypothetical example:
- Well, I suppose X should be positive and that X=10,000 is unrealistically high, for whatever reason.
- However, X=1, X=10, X=100, and X=1,000 all seem like they are perfectly reasonable values.
- If X=1, then I can calculate Y=1; if X=10, then Y=2; if X=100, Y=3; etc.
We will use this information by first drawing an analogy between “uncertainty in X” and “a random variable X.” Because we are uncertain about the exact value of parameter X, we can instead randomly set the dial that tunes this parameter according to our beliefs outlined above. We calculate the prediction Y and think of this as one of many possible values Y could have. We then repeat the process many times to build a large sample of the model’s prediction. Instead of having one simple prediction, the model then has a range of possible predictions that are weighted according to this random sample. The hope is that a good model will have a small spread for its predictions.
In our recent paper we took this a step further and used the power of the Central Limit Theorem to give us easily characterized results for the CMB, in terms of far fewer parameters than you might naively expect. The Central Limit Theorem says that independent random variables (our model’s parameters) act like a single normally distributed variable when you add a bunch of them together. A normal distribution has only two parameters, the mean and variance, which effectively cancels out a lot of the model’s complexity, leaving only a few dials that we can tune in our inflationary machinery.
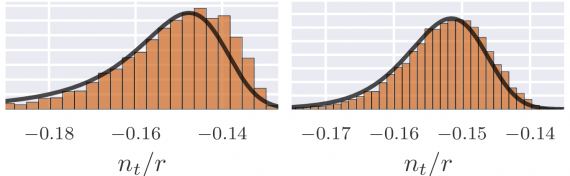
A prediction for the CMB, with a different number of degrees of freedom in the underlying model. The inflationary consistency relation, measured by the ratio n/r fits very closely to what is predicted by the Central Limit Theorem.
We did this for one of the most interesting observables, which is called the “inflationary consistency relation,” which relates the gravitational waves produced during inflation to the wrinkles in the universe’s curvature. In principle, we can measure this using the hot and cold spots in the CMB or by galaxy surveys. The “toy” inflation models all predict the exact same thing, while the more realistic models with many degrees of freedom can break it. However, we were able to show that a large class of the complicated models actually give a sharp prediction, which becomes more and more precise as we add more complexity to the model (in terms of numbers of quantum fields). This is more evidence that models with lots of knobs and dials can be surprisingly insensitive to their exact settings. Hopefully this means that we only have to know the broad-strokes of the high energy theories in order to get simple answers, similar to our well-studied toy models.
So, I suppose the moral of the story is: even a complicated recipe should still give us a simple cake in the end, and you can tell a simple recipe and a complex recipe apart by looking at the cake!
You can read more here:
L.C. Price, H.V. Peiris, J. Frazer, R. Easther
Gravitational wave consistency relations for multifield inflation
R. Easther, J. Frazer, H.V. Peiris, L.C. Price
Simple predictions from multifield inflationary models
New maps from ESA’s Planck satellite, forming the second major data release (Feb 2015) from the project, have unveiled the ‘polarised’ light from the early Universe across the entire sky, revealing that the first stars formed much later than previously thought. These results are due to the hard work of hundreds of scientists from all over the world! Here we’ll point out some highlights from the new data, focusing in particular on contributions to this huge scientific endeavour made by EarlyUniverse@UCL members!
A major source of information used to piece together the 13.8 billion-year story of the Universe is the cosmic microwave background (CMB) the fossil light resulting from a time when the Universe was hot and dense, only 380,000 years after the Big Bang. Light is polarised when it vibrates in a preferred direction, something that may arise as a result of photons – the particles of light – bouncing off other particles, like electrons. This is exactly what happened when the CMB originated in the early Universe. The CMB light detected by Planck retains a memory of its last encounter with the electrons, captured in its polarisation. The 2015 data release unveils the first high resolution maps of CMB polarisation over the full sky.
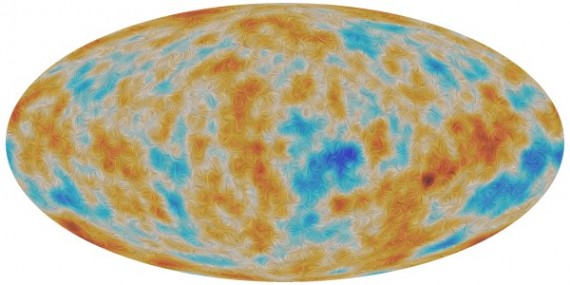
A visualisation of the polarisation of the Cosmic Microwave Background, or CMB, as detected by ESA’s Planck satellite over the entire sky. The CMB is a snapshot of the oldest light in our Universe, imprinted on the sky when the Universe was just 380 000 years old. It shows tiny temperature fluctuations that correspond to regions of slightly different densities, representing the seeds of all future structure. A small fraction of the CMB is polarised – it vibrates in a preferred direction. In this image, the colour scale represents temperature differences in the CMB, while the texture indicates the direction of the polarised light. The patterns seen in the texture are characteristic of ‘E-mode’ polarisation, which is the dominant type for the CMB. For the sake of illustration, both data sets have been filtered to show mostly the signal detected on scales around 5 degrees on the sky. However, fluctuations in both the CMB temperature and polarisation are present and were observed by Planck on much smaller angular scales, too. (Credit: ESA/Planck)
The nature of the polarised signal observed by the Planck detectors can be reconstructed with very high precision thanks to the detailed analysis of the polarisation efficiency and spectral measurements performed during ground calibrations by Giorgio Savini.
Planck’s polarisation data confirm the details of the standard cosmological picture determined from its measurement of the CMB temperature fluctuations, but add an important new answer to a fundamental question: when were the first stars born?
As the first stars began to shine, their light interacted with gas in the Universe, and more and more of the atoms were turned back into their constituent particles: electrons and protons. This key phase in the history of the cosmos is known as the ‘epoch of reionisation’. The newly liberated electrons were once again able to collide with the light from the CMB, leaving a tell-tale imprint on the polarisation of the CMB. Planck’s observations of the CMB polarisation now tell us that the first stars formed some 550 million years after the Big Bang – more than 100 million years later than previously thought. This later date on the end of the “Dark Ages” of the Universe implies that it might be easier to detect the very first generation of galaxies with the next generation of observatories, including the James Webb Space Telescope.
New in the 2015 release is the use of high resolution polarisation information of CMB data, providing a powerful and nearly independent test of the temperature-only analysis. The standard cosmological model remains an excellent fit to the data. The data have also enabled new important insights into the early cosmos and its components, including the intriguing dark matter and the elusive neutrinos. In practice, estimating the cosmological parameters requires a statistical framework to confront theory predictions with the data. As a member of the Planck team, Franz Elsner led the development of this analysis pipeline. This task involved the numerical implementation of the algorithm, improving its accuracy, and a comprehensive verification effort on the basis of simulations.
Also new in 2015 is the use of both the anisotropies of the temperature and polarisation of the CMB to reconstruct the entire distribution of the matter from the moment it was emitted 380,000 years after the Big Bang. With extended data Planck has measured, to 2.5% precision, the amplitude of the fluctuations in matter when the Universe was about 3 billion year old. Aurélien Benoit-Lévy contributed to this milestone, as well as creating sky masks that reject the contamination due to foreground emissions that enabled robust cosmological analysis.
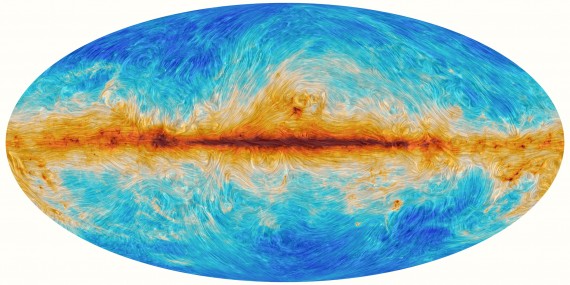
The interaction between interstellar dust in the Milky Way and the structure of our Galaxy’s magnetic field, as detected by ESA’s Planck satellite over the entire sky. Among the foreground sources at the wavelengths probed by Planck is cosmic dust, a minor but crucial component of the interstellar medium that pervades the Galaxy. Mainly gas, it is the raw material for stars to form. Interstellar clouds of gas and dust are also threaded by the Galaxy’s magnetic field, and dust grains tend to align their longest axis at right angles to the direction of the field. As a result, the light emitted by dust grains is partly ‘polarised’ – it vibrates in a preferred direction – and, as such, could be caught by the polarisation-sensitive detectors on Planck. Scientists in the Planck collaboration are using the polarised emission of interstellar dust to reconstruct the Galaxy’s magnetic field and study its role in the build-up of structure in the Milky Way, leading to star formation. In this image, the colour scale represents the total intensity of dust emission, revealing the structure of interstellar clouds in the Milky Way. The texture is based on measurements of the direction of the polarised light emitted by the dust, which in turn indicates the orientation of the magnetic field. (Credit: ESA/Planck)
The Planck data have delved into the even earlier history of the cosmos, all the way to inflation – the brief era of accelerated expansion that the Universe underwent when it was a tiny fraction of a second old. As the ultimate probe of this epoch, astronomers are looking for a signature of gravitational waves triggered by inflation and later imprinted on the polarisation of the CMB. No direct detection of this signal has yet been achieved. However, when combining the newest all-sky Planck data with the latest results from the BICEP/Keck Collaboration the limits on the amount of primordial gravitational waves are pushed even further down to achieve the best limits yet. As part of this effort Hiranya Peiris tested models of inflation using the latest Planck temperature and polarisation data, searching for tell-tale fingerprints of new physics that operate at the enormous energy scales during inflation.
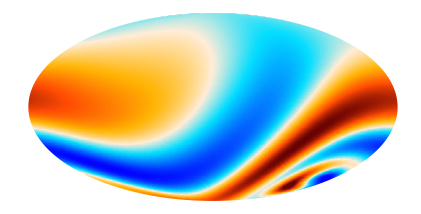
In so-called Bianchi models the Universe has a non-trivial geometry. In such models, a weak swirl-like pattern can be induced in the CMB in addition to the standard fluctuations, in both temperature and polarisation, as shown in the image above. The Planck Team searched for the swirl-like signatures of these models to see whether our Universe could exhibit a non-trivial geometry. (Credit: ESA/Planck)
Einstein’s theory of general relativity tells us about the local curvature of space-time but it cannot tell us about the global topology of the Universe. It is possible that our Universe might have a non-trivial global topology, wrapping around itself in a complex configuration. It is also possible that our Universe might not be isotropic, i.e., the same in all directions. In the 2013 Planck results, some intriguing hints of non-standard geometry were found, suggesting that our Universe might be slightly anisotropic. The Planck 2015 results extended the analysis to include polarisation data for the first time, which provides additional constraining power. These additional data allowed the Planck team including Jason McEwen to strongly rule out the hints of anisotropy seen in the previous analysis. While not a member of the Planck team, Andrew Pontzen computed some of the theoretical predictions that were tested in the analysis. The latest Planck results suggest we live in a Universe with simple topology and geometry, ruling out alternative exotic scenarios and directly testing one of the fundamental assumptions of the standard cosmological model.

A summary of the almost 14 billion year history of the Universe, showing in particular the events that contributed to the CMB. The processes depicted range from inflation, the brief era of accelerated expansion that the Universe underwent when it was a tiny fraction of a second old, to the release of the CMB, the oldest light in our Universe, imprinted on the sky when the cosmos was just 380 000 years old; and from the ‘Dark Ages’ to the birth of the first stars and galaxies, which reionised the Universe when it was a few hundred million years old, all the way to the present time. (Credit: ESA/Planck)
You can read more here:
Planck Collaboration
Planck 2015 results. I. Overview of products and scientific results
Planck Collaboration
Planck 2015 results. XIII. Cosmological parameters
Planck Collaboration
Planck 2015 results. XX. Constraints on inflation
Planck Collaboration
Planck 2015 results. XVII. Constraints on primordial non-Gaussianity
Planck Collaboration
Planck 2015 results. XV. Gravitational lensing
Planck Collaboration
Planck 2015 results. XVIII. Background geometry and topology of the Universe
We are very excited that our work on simulating cosmic bubble collisions in full General Relativity has been recognised with third place in the inaugural Buchalter Cosmology Prize, announced in January at the 225th meeting of the American Astronomical Society in Seattle, Washington. The annual prize, created by Dr. Ari Buchalter in 2014, seeks to reward new ideas or discoveries that have the potential to produce a breakthrough advance in our understanding of the origin, structure, and evolution of the universe.
Co-author Max Wainwright previously blogged about this work for EarlyUniverse@UCL, and co-authors Hiranya Peiris and Matt Johnson were interviewed by Quanta Magazine for a feature about this work last year. You can find out more about this work in the following video created by the Perimeter Institute!
We are pleased to announce the release of the template maps used in Leistedt and Peiris (2014) and Leistedt, Peiris and Roth (2014). These maps result from projecting the properties of the SDSS photometric images (DR8-10) that are potential sources of systematics for galaxy and quasar clustering studies. An example is given below.
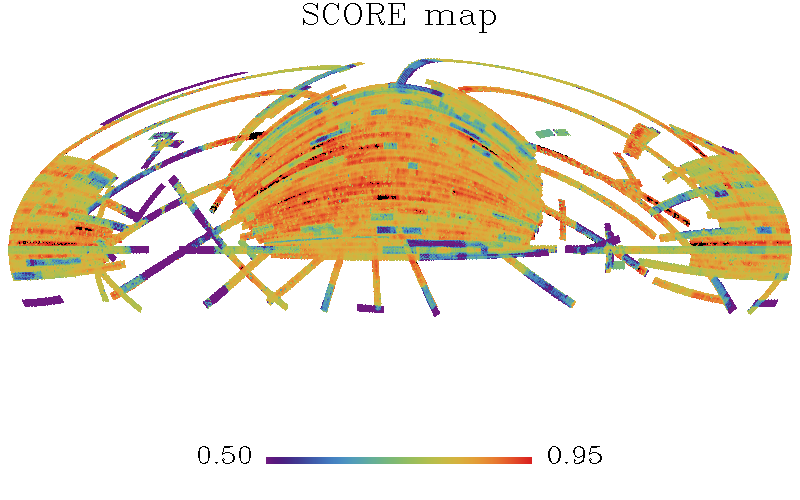
‘Score’ map assessing the spatial quality of the SDSS DR10 photometric data.
These quantities are all extracted from the FIELDS table in the SDSS database (collecting many useful properties of the SDSS images and fields), and projected using the Mangle software. The resulting maps, released as HEALPix maps at Nside=256 resolution, can be downloaded in the ‘code’ section of this website. If you make use of these maps, please cite the two papers below.
B. Leistedt, H. Peiris
Exploiting the full potential of photometric quasar surveys: Optimal power spectra through blind mitigation of systematics
B. Leistedt, H. Peiris, N. Roth
Constraints on primordial non-Gaussianity from 800,000 photometric quasars
Written by Nina Roth, Figures by Boris Leistedt.
This is a multi-verse explanation
of how to constrain models of inflation,
with signals that are seen today
in a large-scale galaxy survey.
We start with a brief repetition
of some concepts, facts and definitions,
because the basis of our current study
is the standard model of cosmology.
The theory of structure formation
is based on inflated quantum fluctuations,
whose amplitudes (for the simplest solution)
should follow a Gaussian distribution.
Any deviation from this simple case
will teach us about physics in a phase
where our Universe was (behold!)
only fractions of fractions of a second old.
A large signal is not expected
and so far remains undetected.
We’ll call this effect PNG,
short for Primordial non-Gaussianity.
The amplitude of PNG
is constrained by the CMB
(the Cosmic Microwave Background),
and these results are pretty sound.
A signal of PNG from inflation
also comes from the galaxy correlation,
for example if the bias deviates
from a constant value on large scales.
And quasars are an ideal candidate:
They’re bright and also strongly correlate
with the dark matter density peaks;
these properties are what one seeks.
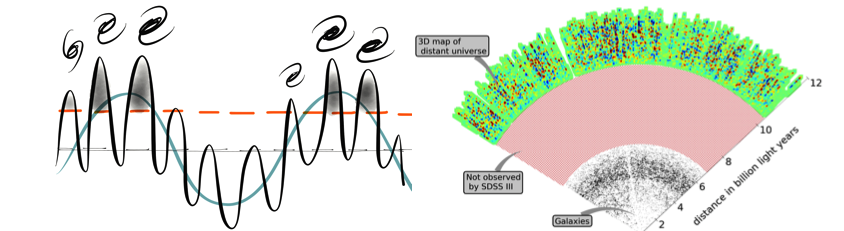
Figure 1: Left panel: A simplified picture of structure formation: galaxies form in places where the matter overdensity (black solid) line reaches a critical value (orange dashed line). Quasars are galaxies with very large masses and are therefore expected to form in very overdense regions. Right panel: A section of observation from the Sloan Digital Sky Survey (SDSS). The 3rd dimension has been projected onto the plane of distance and angle on the sky. The observer sits at the tip of the cone and each black point corresponds to a relatively nearby galaxy. Quasars are typically located at much larger distances (colored region) and occupy a much larger spatial volume.
The trouble with these observations
is the level of contaminations,
’cause quasars look like stars you see
without detailed spectroscopy.
But for the large volumes that we need
spectroscopic data is highly incomplete.
The sample’s distance and its purity
is thus solely based on photometry.
These systematics often obfuscate
the signal that we try to separate.
And if these effects cannot be mitigated,
no proper values can be estimated.
One solution (the conservative way)
would be to throw some data away,
by masking regions where contaminations
create effects that disagree with expectations.
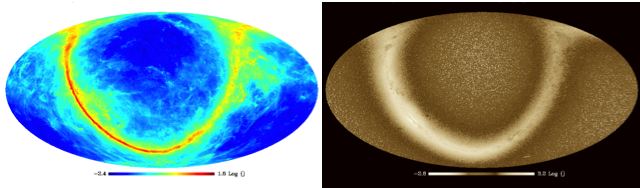
Figure 2: Full sky projections of two possible contaminants. Left panel: emission by dust grains (observed with the Planck satellite), right panel: number density of point sources (these could be nearby stars or far away quasars). In each panel, the bright band shows the location of the Milky Way plane.
“But wait” we said, “Oh what a waste
of precious data that can’t be replaced!”
And how can you even know for sure
which part is “wrong” and which is “pure”?
Instead we use for our detection
a method that’s called “mode projection”.
Through clever use of cross-correlations
we clean the data of contaminations.
This process is based on statistics
which makes us highly optimistic:
It won’t just find what you hope to find
(in proper terms: the method’s “blind”)
And so from just one set of data
we get precision that is greater
than what has been obtained before
from two experiments – or even more!
The measured values still permit
a lot of theories that would fit
in addition to the standard one,
so work on this is far from done.
This is the end of our rhyme
we hope you found it worth your time,
and if you are int’rested further
head over to the preprint server.
You can read more here:
B. Leistedt, H. Peiris, N. Roth
Constraints on primordial non-Gaussianity from 800,000 photometric quasars
B. Leistedt, H. Peiris
Exploiting the full potential of photometric quasar surveys: Optimal power spectra through blind mitigation of systematics
B. Leistedt, H. Peiris, D. Mortlock, A. Benoit-Lévy, A. Pontzen
Estimating the large-scale angular power spectrum in the presence of systematics: a case study of Sloan Digital Sky Survey quasars
