This post was written by Keir K. Rogers
Here at UCL, we’ve been working on the small problem of the origin of the largest structures known to humans — the ordered arrangement of galaxies in space. We have an elegant theory that can trace back these formations to microscopic fluctuations during an accelerated expansion at the Big Bang called cosmic inflation. We’ve even predicted a signal in the afterglow of the Big Bang that — if discovered — would teach us the physics of inflation. But, searches for this signal are hampered by the glow from particles in the Milky Way. We have developed and tested a method that could help to clean away these foregrounds and give us a clear view of the primordial signal that reveals the origin of structure.
The cosmic web

Figure 1: galaxies as seen by the Sloan Digital Sky Survey (SDSS) are arranged into a web-like pattern. Red shows the dense clusters and green shows less dense regions. Image credit: SDSS
Since the ancient Greeks first put the Sun at the centre of the Universe, we have wondered what is the order of the heavens? When we today map the positions of the hundreds of millions of galaxies that we have observed so far, we see them trace out a remarkable structure. They are gathered into a complex network of dense clusters, long filaments, wide walls and vast voids in-between: all together, we call this panoply the cosmic web (figure 1). As we look back into space (and so in time), we realise that, as the Universe aged, galaxies gravitationally attracted each other into ever larger conglomerations. But we can ask and try to answer a question far more profound than the ancient Greeks did (who were not interested in applying their laws of physics beyond the Earthly realm): why are the heavens ordered the way they are? What is the origin of the order we see in space?
When we map the sky at microwave frequencies, we see a faint background of light. This cosmic microwave background (CMB) originates from the baby Universe — when it was only 380,000 years old. The photons have travelled towards us — largely unimpeded — for the over 13 billion years since. The temperature of this background is impressively uniform across the sky. The fluctuations are minuscule — amounting to only one part in a 100,000.
The seeds of cosmic structure are traced by the tiny fluctuations in the CMB. They give us the positions of the small over- and under-densities in the matter distribution in the early Universe, which eventually grew under gravity into the clusters and voids we see today. But what is the origin of these tiny perturbations superposed on a smooth background?
The theory of inflation as the origin of structure
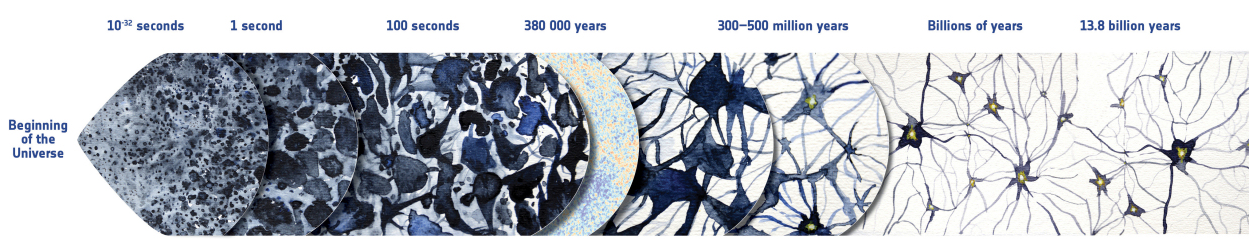
Figure 2: a schematic view of the theory of inflation as the origin of the cosmic web. Quantum fluctuations at the beginning of the Universe (left-hand side) grew over the length of cosmic history into the clusters and filaments of galaxies we see today, 13.8 billion years later (right-hand side). We can observe light released at 380,000 years (the cosmic microwave background) to see an intermediate point in this evolution. Image credit: European Space Agency (ESA)
The leading theoretical explanation is a lightning-fast burst of accelerated expansion of space in the first fraction of a second of the Universe — called cosmic inflation. This expansion pushed apart regions of space that were in causal contact — and so were smoothed out. Only at the end, do we begin to regain contact with ever more distant patches of space. Moreover, this expansion can be driven by a scalar field and an associated particle, the inflaton. Quantum fluctuations in this field were expanded to macroscopic scales by the end of inflation. These fluctuations were the source of the primordial density perturbations that are the seeds of structure (figure 2). Inflation can elegantly answer the question of the origin of structure — and provide the smooth background we see in the CMB.
There is some evidence to support the theory of inflation — in the way the CMB fluctuations are patterned in the sky. But there is a key prediction that would provide truly compelling evidence. This is the generation of a background of gravitational waves — oscillations in the fabric of spacetime. Unfortunately for us, these ripples are far too weak for our current technology to directly detect. We are only just now sensing the relatively violent disruptions from merging massive stars. There is more hope with the next generations of interferometers which will deploy in space; though it will probably be decades before we gain any significant insight in this way. Fortunately for us, the Universe has built a far larger instrument that we can use: the CMB.
Primordial CMB B modes as evidence for inflation
It turns out there is far more information lurking in the CMB than just the temperature fluctuations. The CMB is (partially) linearly polarised; this means there is a preferred direction in the oscillations of the electric and magnetic fields that make up the light. It’s convenient for us to split these polarisation measurements into what we call E and B modes, depending on their properties. Gravitational waves should be the only primordial source of B modes in the CMB. This has the remarkable consequence that a detection of primordial polarisation B modes in the CMB would provide the compelling evidence for inflation we’ve been looking for!
Of course, life is not that simple! There are at least two more sources of CMB B modes that we need to worry about. The first is lensing B modes. This is the deflection of CMB photons by massive structures like galaxy clusters — known as gravitational lensing. This has the effect of distorting primordial E modes into B modes. We need sophisticated statistical methods to separate the primordial and lensing signals. A measurement of the lensing modes gives us unique information about the distribution of the cosmic structure that deflected the CMB photons — as well as properties of subatomic particles called neutrinos that affect this structure.
Polarised microwave foregrounds

Figure 3: a full-sky map (in Mollweide projection) of the polarised microwave radiation (at 353 GHz) released by dust particles in the Milky Way. The colour shows the amplitude of the polarisation: red is higher amplitude and blue is lower amplitude. The drapery pattern shows the direction of the polarisation and reveals the filamentary nature of polarised microwave foregrounds. Image credit: ESA Planck
The second contamination is somewhat closer to home — for cosmologists, at least! It is polarised foreground radiation from sources in our own Milky Way. At lower microwave frequencies, we face the problem of polarised synchrotron radiation. This is emitted by electrons that are accelerated in the Galaxy’s giant magnetic field. At higher microwave frequencies, we need to deal with polarised thermal dust radiation. The Milky Way is teeming with tiny grains of dust spread out in interstellar space. These grains are aspherical and so the thermalised radiation they release is polarised — and the direction of the polarisation traces the magnetic field. At least, this is a simple picture of it. There are wildly-varying directions in the turbulent Galactic magnetic field, which makes it challenging to model polarised dust emission. New datasets have revealed the complex, filamentary nature of polarised foregrounds (figure 3). But it is far from being a solved problem — there is no sliver of the sky that is clean of dust!
The BICEP collaboration of scientists found this out when, in 2014, they declared detection of primordial B modes with their telescope at the South Pole. They thought they were looking at a clean patch of the sky. But new data later showed it wasn’t as clean as they had hoped and the signal could be fully attributed to dust. The search continues with new generations of upgraded telescopes scanning the sky.
A clear view of the primordial Universe
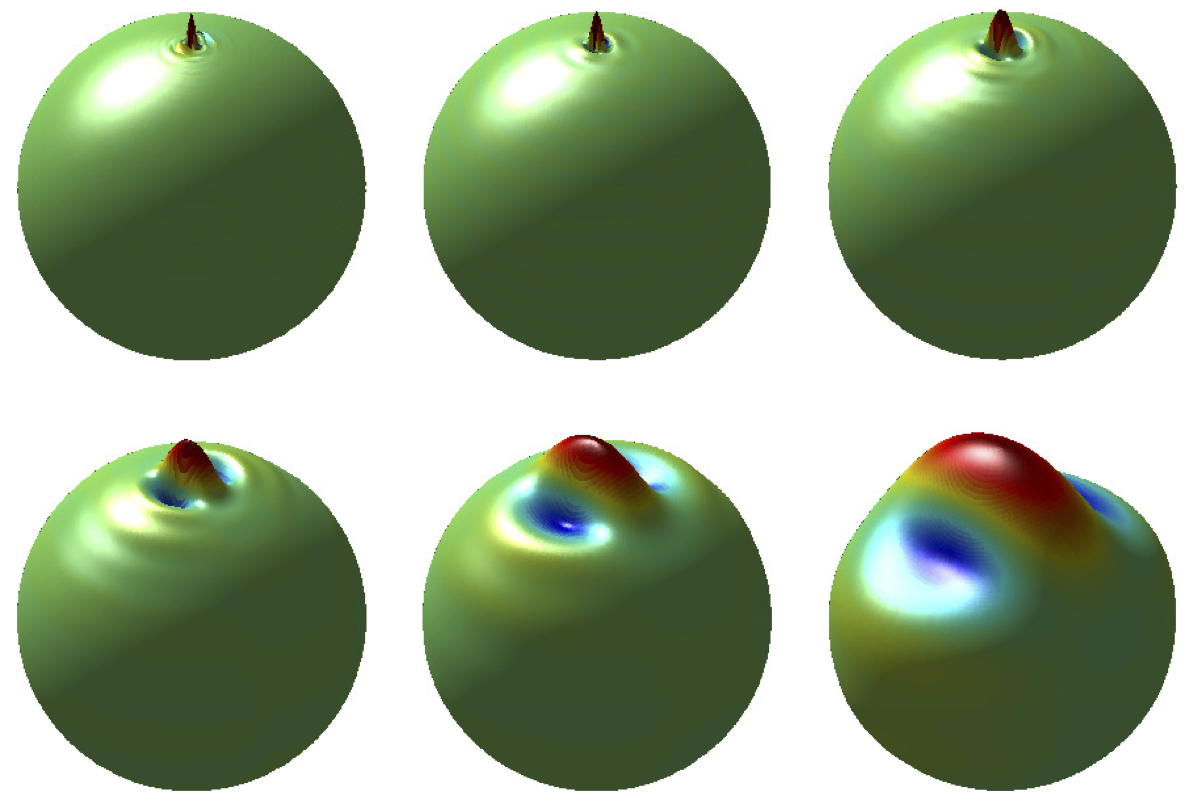
Figure 4: some examples of the directional wavelets we use in our method. They are special filters for signals that are measured on the surface of a sphere (like the CMB, since the full sky forms the inside surface of a sphere). They can be manipulated into different sizes and widths as required, including to match the dust filaments seen in Fig. 3. Red, raised parts show positive response and blue, depressed parts show negative response. Image credit: Jason McEwen
Here at UCL, we worked on a new and different approach to leaping the hurdle of foreground contamination. We wanted to exploit our knowledge of the filamentary nature of polarised foregrounds — but to sidestep having to construct a very detailed picture of the complicated interaction between grains of dust and the Galaxy’s magnetic field. To do this, we needed to use special sets of filters called wavelets. Unlike previous kinds, these wavelets are directional. This means that their shapes are not symmetric about their centre, but long and squeezed. In fact, they can be varied to match the shapes and sizes of the dust filaments we want to remove from our measurements (figure 4)!
The other side of our approach is to exploit another aspect of our data. We map the microwave radiation in the sky at many different frequencies across the microwave spectrum. At low frequencies (about 30 GHz), it’s dominated by synchrotron photons. At high frequencies (about 300 GHz), it’s dominated by thermal dust photons. We can effectively use these maps as templates for the foreground contamination and subtract them from a map we make at a middle frequency (about 100 GHz). Then we should be left with (mostly) primordial and lensing signal. The simplest way to do this addition and subtraction of maps is to make an internal linear combination (ILC). This adds and subtracts multiple maps with different weights for each one — e.g., the Planck satellite provides seven such maps for this purpose. The weights are optimally chosen to minimise the amount of contamination in our final map of the cosmological signal.
Now we can put all the pieces together. We might expect that the optimal weights will depend on the structure and shape of the foreground filaments. They are each a different physical region of the Milky Way. But, we’d like a way to disentangle these filaments. Well, this is exactly what the directional wavelets can do! If we first filter our input maps with these wavelets, picking out filaments of a certain size, shape and orientation, then we can apply the ILC in a localised way.
We tested our method on the latest data from the Planck satellite and found that it certainly has the potential to help clean observations by future experiments! This is an exciting result. It seems now that through a combination of new methods like these, a better understanding of polarised foregrounds and more sensitive data, we have a good chance of detecting primordial B modes in the future. If they’re there to be detected! Nature could be cruel to us and make the background so weak we have no chance of finding it. Or the theory of inflation may be wrong — and there is no background of gravitational waves to discover! Whatever the outcome, it will teach us some profound truths about the origin of the Universe.
You can read more here:
K.K. Rogers, H. V. Peiris, B. Leistedt, J. D. McEwen, A. Pontzen
SILC: a new Planck internal linear combination CMB temperature map using directional wavelets
K.K. Rogers, H. V. Peiris, B. Leistedt, J. D. McEwen, A. Pontzen
Spin-SILC: CMB polarisation component separation with spin wavelets
