Written by Nina Roth, Figures by Boris Leistedt.
This is a multi-verse explanation
of how to constrain models of inflation,
with signals that are seen today
in a large-scale galaxy survey.
We start with a brief repetition
of some concepts, facts and definitions,
because the basis of our current study
is the standard model of cosmology.
The theory of structure formation
is based on inflated quantum fluctuations,
whose amplitudes (for the simplest solution)
should follow a Gaussian distribution.
Any deviation from this simple case
will teach us about physics in a phase
where our Universe was (behold!)
only fractions of fractions of a second old.
A large signal is not expected
and so far remains undetected.
We’ll call this effect PNG,
short for Primordial non-Gaussianity.
The amplitude of PNG
is constrained by the CMB
(the Cosmic Microwave Background),
and these results are pretty sound.
A signal of PNG from inflation
also comes from the galaxy correlation,
for example if the bias deviates
from a constant value on large scales.
And quasars are an ideal candidate:
They’re bright and also strongly correlate
with the dark matter density peaks;
these properties are what one seeks.
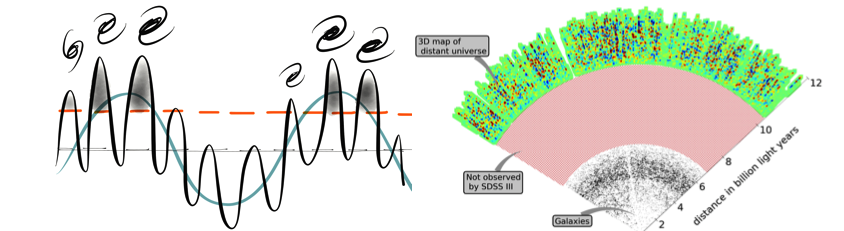
Figure 1: Left panel: A simplified picture of structure formation: galaxies form in places where the matter overdensity (black solid) line reaches a critical value (orange dashed line). Quasars are galaxies with very large masses and are therefore expected to form in very overdense regions. Right panel: A section of observation from the Sloan Digital Sky Survey (SDSS). The 3rd dimension has been projected onto the plane of distance and angle on the sky. The observer sits at the tip of the cone and each black point corresponds to a relatively nearby galaxy. Quasars are typically located at much larger distances (colored region) and occupy a much larger spatial volume.
The trouble with these observations
is the level of contaminations,
’cause quasars look like stars you see
without detailed spectroscopy.
But for the large volumes that we need
spectroscopic data is highly incomplete.
The sample’s distance and its purity
is thus solely based on photometry.
These systematics often obfuscate
the signal that we try to separate.
And if these effects cannot be mitigated,
no proper values can be estimated.
One solution (the conservative way)
would be to throw some data away,
by masking regions where contaminations
create effects that disagree with expectations.
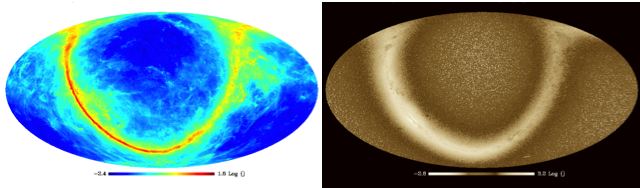
Figure 2: Full sky projections of two possible contaminants. Left panel: emission by dust grains (observed with the Planck satellite), right panel: number density of point sources (these could be nearby stars or far away quasars). In each panel, the bright band shows the location of the Milky Way plane.
“But wait” we said, “Oh what a waste
of precious data that can’t be replaced!”
And how can you even know for sure
which part is “wrong” and which is “pure”?
Instead we use for our detection
a method that’s called “mode projection”.
Through clever use of cross-correlations
we clean the data of contaminations.
This process is based on statistics
which makes us highly optimistic:
It won’t just find what you hope to find
(in proper terms: the method’s “blind”)
And so from just one set of data
we get precision that is greater
than what has been obtained before
from two experiments – or even more!
The measured values still permit
a lot of theories that would fit
in addition to the standard one,
so work on this is far from done.
This is the end of our rhyme
we hope you found it worth your time,
and if you are int’rested further
head over to the preprint server.
You can read more here:
B. Leistedt, H. Peiris, N. Roth
Constraints on primordial non-Gaussianity from 800,000 photometric quasars
B. Leistedt, H. Peiris
Exploiting the full potential of photometric quasar surveys: Optimal power spectra through blind mitigation of systematics
B. Leistedt, H. Peiris, D. Mortlock, A. Benoit-Lévy, A. Pontzen
Estimating the large-scale angular power spectrum in the presence of systematics: a case study of Sloan Digital Sky Survey quasars
